How to make Data Visualizations THAT GO VIRAL (with ggplot2 in R)
Written by Matt Dancho
Quit “storytelling with data”. There’s a reason your data visualizations aren’t working. Hear me out. If you’re a data scientist or data analyst who wants to get an executive to stop from looking at his phone and to start looking at your slide deck OR someone on LinkedIn to stop mindlessly scrolling and start reading your post, then this 5-minute tutorial will help you.
Table of Contents
- The art of persuassion: The STOP AND PAY ATTENTION Framework.
- How to make THIS VIRAL Data Visualization in R: FULL Code Walkthrough with the
tidyverse and ggplot2)
- BONUS: How to get the Excel file, data, and 100 lines of code to make the visualization for FREE (instructions at the end) 👇
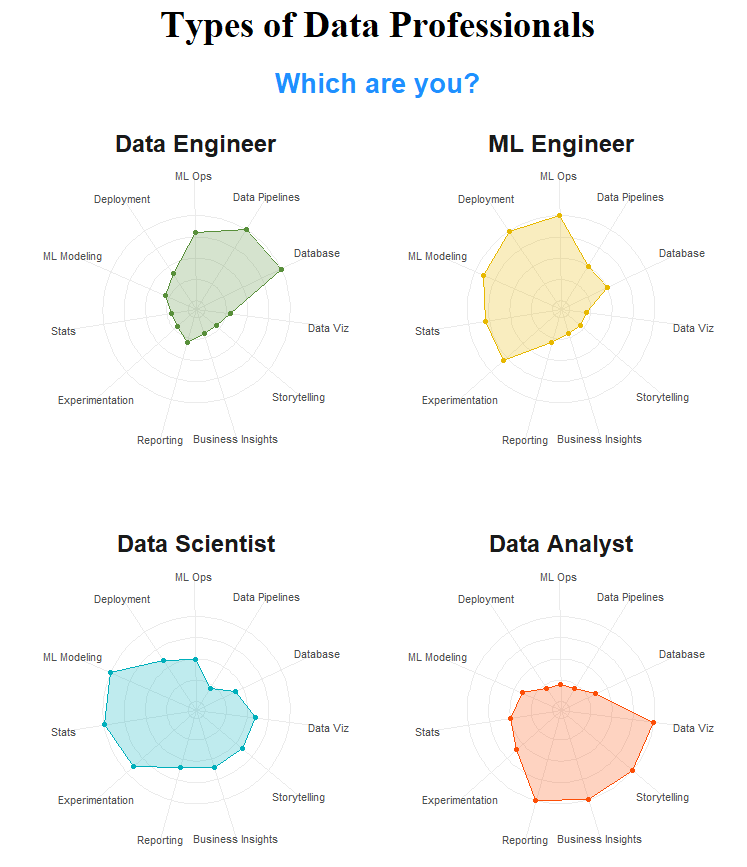
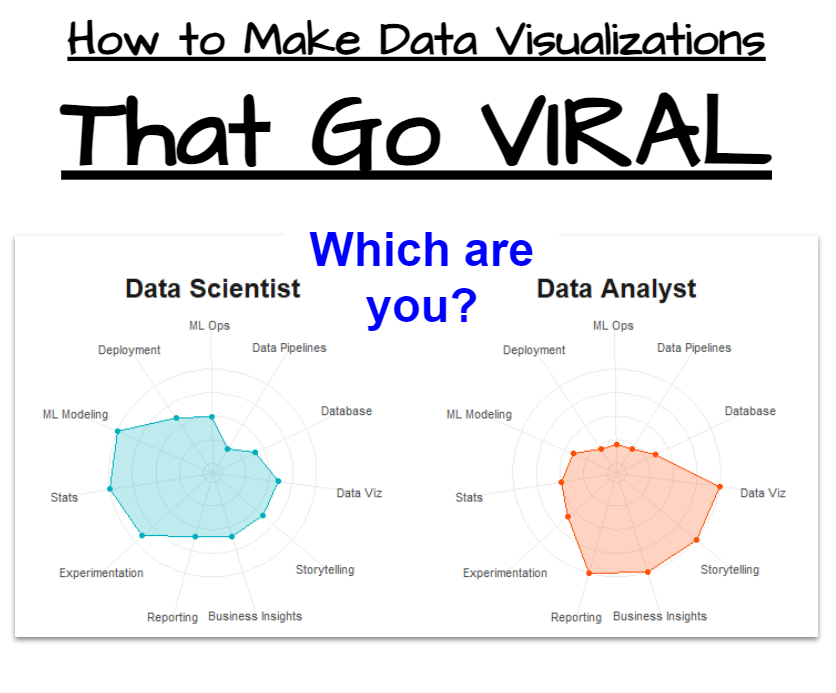
Types of Data Professionals Radar Plot (The VIRAL Data Visualization you make today)
And an extra bonus you get today:
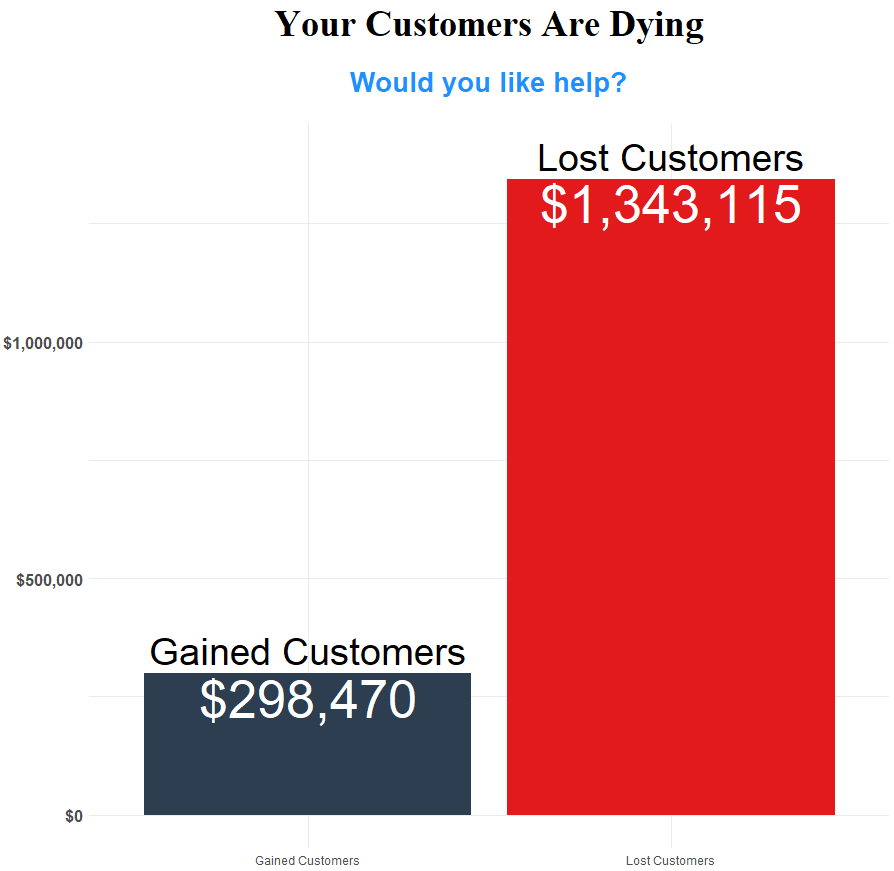
Your Customers are Dying Plot (A Force Multiplier for Attention)
SPECIAL ANNOUNCEMENT: AI for Data Scientists Workshop on December 18th
Inside the workshop I’ll share how I built a SQL-Writing Business Intelligence Agent with Generative AI:

What: GenAI for Data Scientists
When: Wednesday December 18th, 2pm EST
How It Will Help You: Whether you are new to data science or are an expert, Generative AI is changing the game. There’s a ton of hype. But how can Generative AI actually help you become a better data scientist and help you stand out in your career? I’ll show you inside my free Generative AI for Data Scientists workshop.
Price: Does Free sound good?
How To Join: 👉 Register Here
R-Tips Weekly
This article is part of R-Tips Weekly, a weekly video tutorial that shows you step-by-step how to do common R coding tasks. Pretty cool, right?
Here are the links to get set up. 👇
This Tutorial is Available in Video
I have a companion video tutorial that walks you through how to use gt and gtExtras for this analysis. 👇
The Art of Persuassion (The “STOP and Pay Attention” Technique)
The problem is you suck at getting people to pay attention to you. I know because I’ve been there (and spent the last 6 years improving my ability to market myself and my company.)
At first I had zero followers. An email list of zero. And my company started with zero money its bank account. I had become an above average data scientist, but the bottom line was that I was absolutely terrible at marketing. In fact, my first articles got virtually zero views. They were complete and utter garbage.
Today, Business Science has a 120,000+ email list. And is doing 6-figures every month. And to get this game-changing progress for my company, going viral was essential.
But even if you’re not a marketer, overlooking this critical skill is a death-sentence for your Data Science career. This is why:
Why NOT Going Viral is a Death-Sentence for YOUR Data Science Career
Virality is the ability to control eyeballs. It’s essential in any job role:
- Whether you are competing for funding for a project at work
- Or you are competing for eyeballs on LinkedIn, Twitter, Instagram, Tiktok, YouTube, etc
If you can’t control the eyeballs, then you’re failing. Your costing your company money. Your costing your career. Your not making critical connections, and your wasting your time. And that’s a problem.
So how do we fix it?
A Dead-Simple Framework: “STOP AND PAY ATTENTION”
The easiest way to control eyeballs is using a pattern interupt, simply put a way to get them to stop what they are doing and pay attention to me. My vehicle for creating pattern interupts is my “Stop and Pay Attention” framework.:
- “Stop and Pay Attention” is a little framework that I’ve used to get over 100 articles and posts on LinkedIn and Twitter to go viral.
- This has created 50,000+ leads, many of which have converted to paying customers.
- And it’s also just as effective in the board room with a bunch of Executives that are near faking an illness to get out of your next presentation. Here’s the key components:
1. THE STOP ACTION:
I started this R-tips Newsletter article with a pattern interupt (also called a “hook”). The hook is designed to get you to stop scolling and pay attention to what I’m saying. Let’s dig into this pattern interupt:
Quit “Storytelling with data”.
What I’m doing is throwing a stone at a sacred cow: “Story Telling”. A sacred cow is a topic that my target audience (data scientists and data analysts) believe is important to their careers. Truth be told, storytelling is important. But I also know that most data scientists and data analysts suck at it. That’s my in.
2. THE PAY ATTENTION TRANSITION:
The next 2 statements are my “Pay-Attention” transition.
There’s a reason your data visualizations aren’t working. Hear me out.
Tweek the pain point: The first sentence is used to tweek your pain. I know that most data scientists’ reports get thrown in the trash. Their emails go unread. And there’s nothing more depressing than working weeks on a project for an Executive to not even open your email.
Listen to me (pay attention): I then as you to “hear me out.” Give me 30 seconds of your life to explain myself. And now I have you reading this article that I designed for you.
10X Virality with Data Visualizations
It turns out that people process images 1000X faster than they do words. This is the real reason why “Storytelling” is so popular for data scientists and data analysts. Simply put, our Data Visualizations are OUR FORCE MULTIPLIER. 👇
Data Visualizations are a FORCE MULTIPLIER
Including a Data Visualization with this newsletter drives up curiosity and also gives you proof of a promise, I’m going to help you create this “Viral Image”, that has been popularized by me and others on the internet. And leaving this training you get something that you want: Skills to create viral data visualizations with R.
How to APPLY “Stop AND Pay Attention” to Data Science Projects
You’re probably thinking, this “Stop and Pay Attention” stuff sounds great if my goal is to become an LinkedIn rockstar, but how does the “STOP AND PAY ATTENTION” framework help me convince Executives to buy into my data science projects?
The fact is “STOP AND PAY ATTENTION” can be effortlessly adapted to hook Executives. Here’s how.
Let’s take a Customer Churn Project that I want to present my findings on. My audience is non-technical. They are leadership, CEOs, VP’s, Directors. But they don’t know data science.
Here’s my whole Stop AND Pay Attention statement:
“Stop Cold-Emailing Customers. Your Customers are Dying. Let me explain.”
STOP (The Pattern Interrupt):
“Stop Cold-Emailing Customers.”
Pay Attention (Tweak pain. And the transition):
“Your Customers are Dying. Let me explain.”
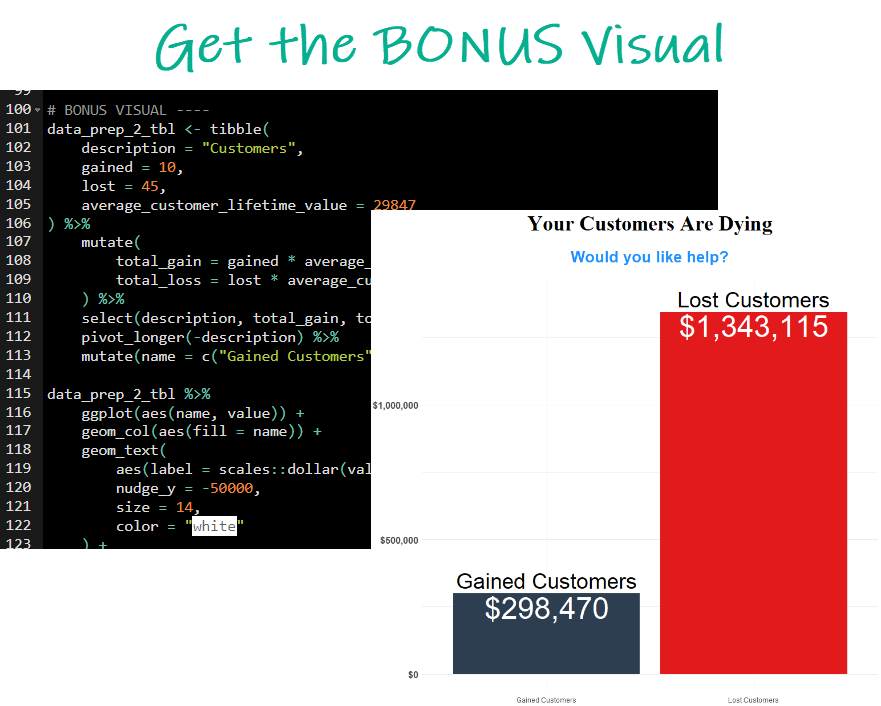
Add a Data Visualization (FORCE MULTIPLIER)
If that hook didn’t get them, then this visual will. I share how much money they gained last month and lost last month. (Code is a bonus for this R-tip)
And that’s the STOP AND APPLY framework (but you want the R code, right?)
Alright, I have a quick tidyverse and ggplot2 tutorial so you can create your own VIRAL DATA VISUALIZATIONS. BUT FIRST…
Free Gift: Cheat Sheet for my Top 100 R Packages (Special Data Analysis Topics Included)
Before we dive in…
You’re going to need R packages to complete the data analysis that helps your company. So why not speed up the process?
To help, I’m going to share my secret weapon…
Even I forget which R packages to use from time to time. And this cheat sheet saves me so much time. Instead of googling to filter through 20,000 R packages to find a needle in a haystack. I keep my cheat sheet handy so I know which to use and when to use them. Seriously. This cheat sheet is my bible.
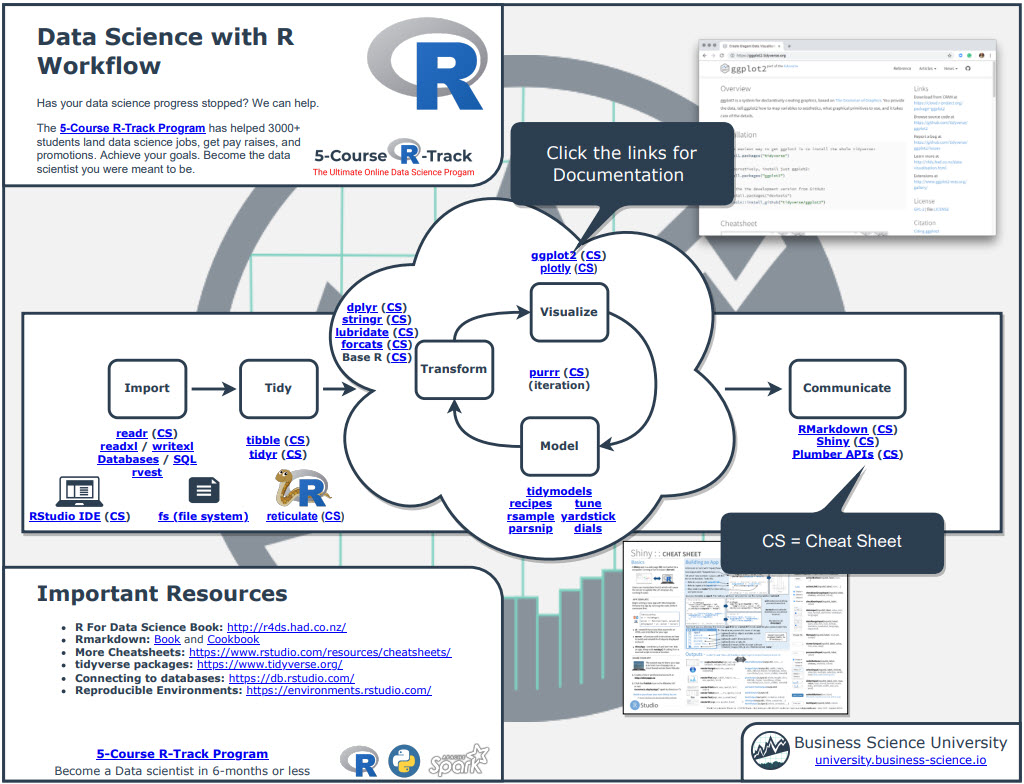
Once you download it, head over to page 3 and you’ll see several R packages I use frequently just for Data Analysis.
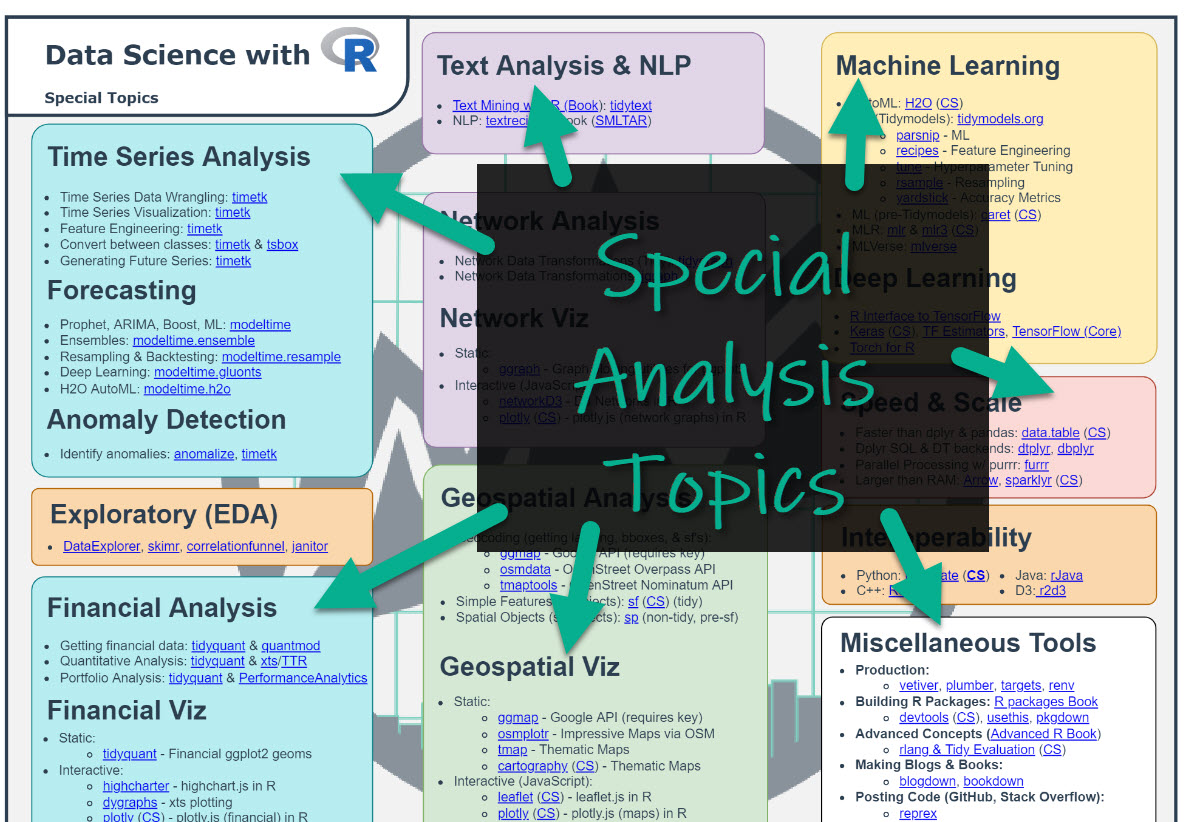
Which is important when you want to work in these fields:
- Machine Learning
- Time Series
- Financial Analysis
- Geospatial Analysis
- Text Analysis and NLP
- Shiny Web App Development
So steal my cheat sheet. It will save you a ton of time.
Tutorial: How to make VIRAL Data Visualizations in R
This tutorial is awesome. You’ll learn how I made the VIRAL “Types of Data Professionals” radar plot. And through this free R-tip, you’ll improve your ability to make VIRAL data visualizations in R. Let’s go.
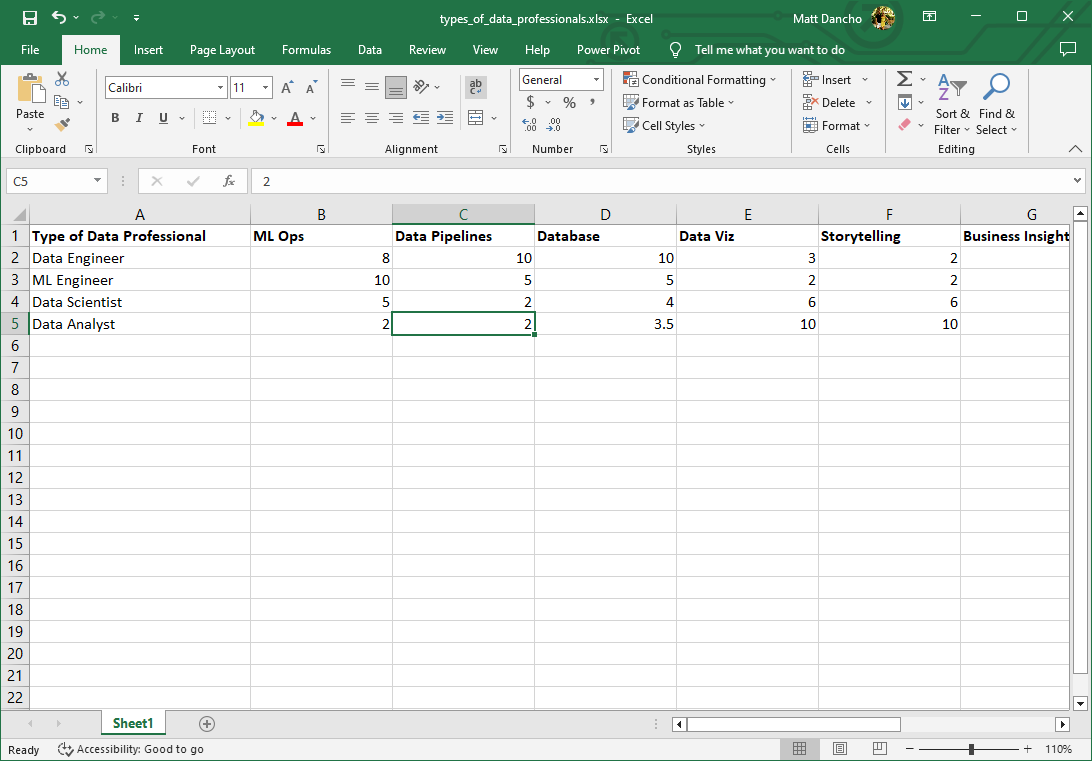
Step 1: Get the Excel File
First, get this Excel file. To do so, join the R-Tips Newsletter. This gets you access to the code for all of my R-Tips.
Get the Excel File.
The Excel file is located in 067_types_of_data_professionals\data\ folder.
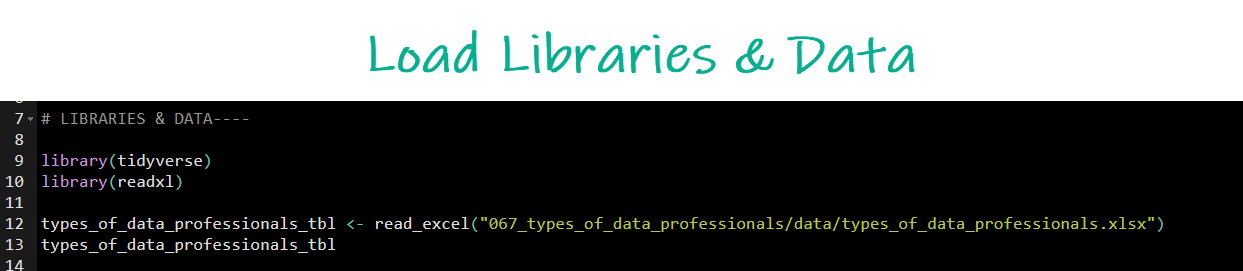
Step 2: Load the Libraries
First, load these libraries and the dataset.
Get the data and code.
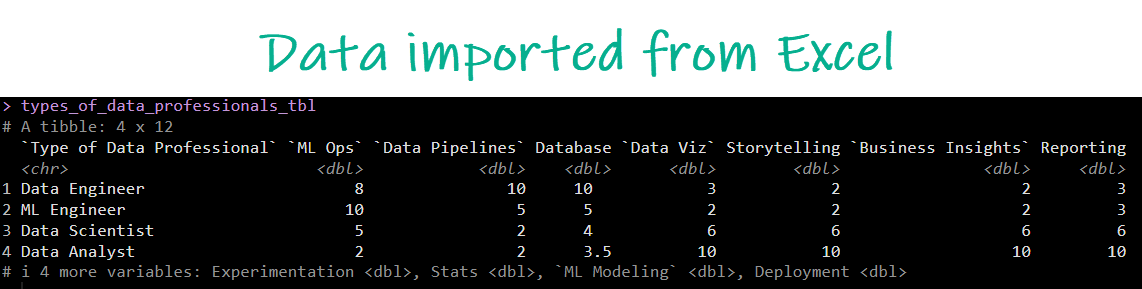
Here’s what the data looks like when imported from the Excel file:
Step 3: Data Preparation
We need to convert the dataset into long format for the “tidy” data visualization. Run this code:
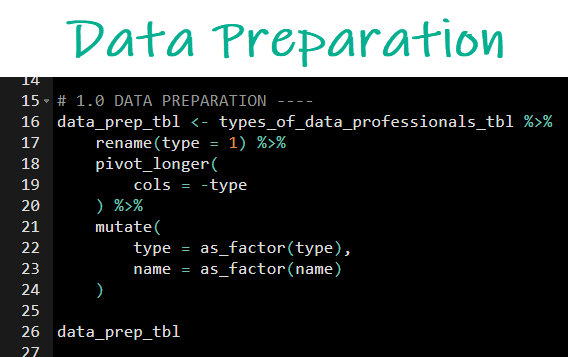
Get the Code.
Here’s what the data looks like after preparation:
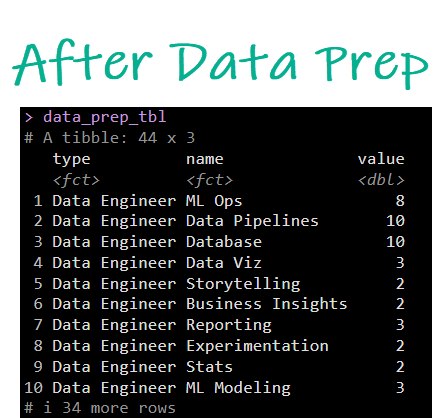
Get the Excel Data.
Step 4: Make the Basic Radar Plot
Run this code to make the basic radar plot.
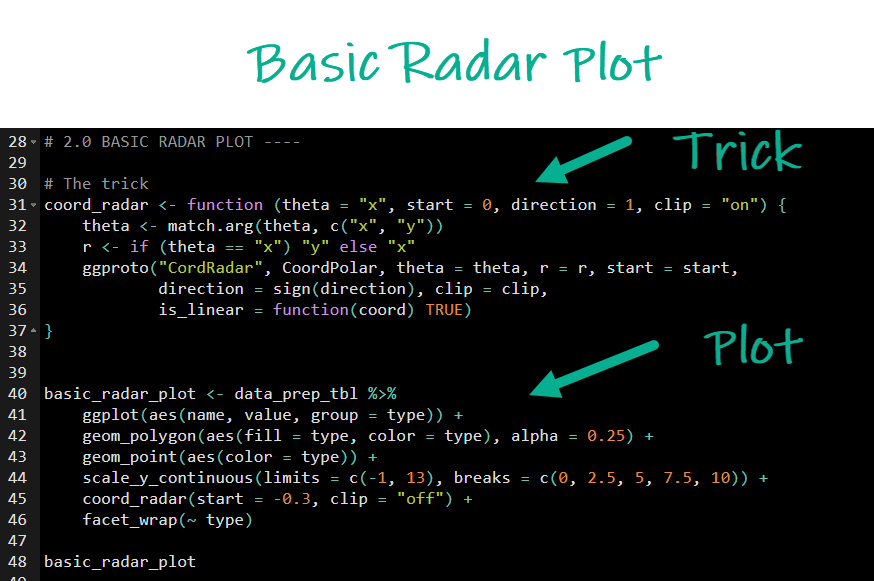
Get the Code.
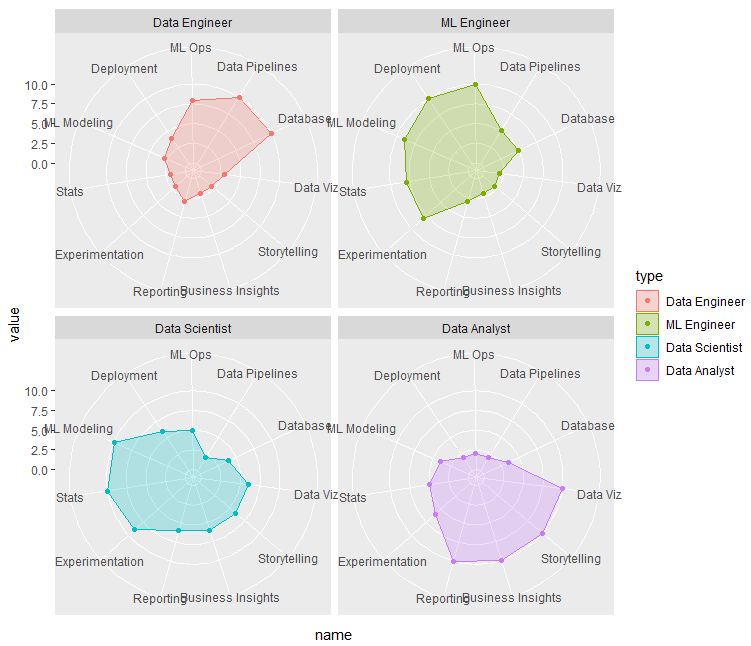
The basic radar ggplot2 plot output:
Step 5: Dress Up the Radar Plot FOR VIRALITY!
If you want to make VIRAL Plots, then you need to dress them up! Let’s customize the plot by running this code:
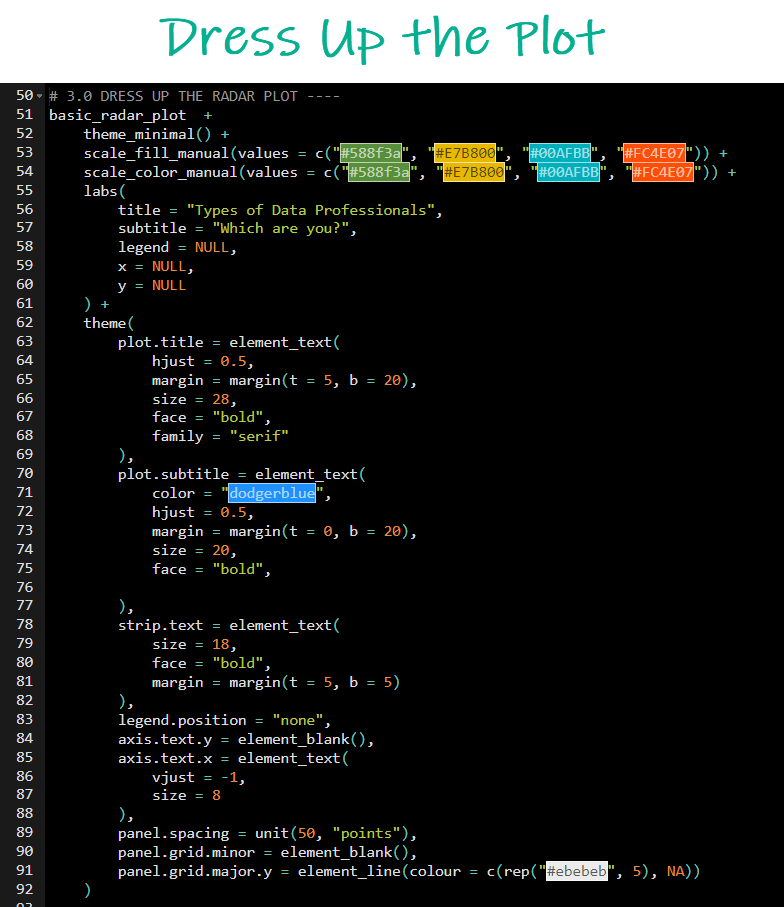
Get the Code.
Here’s what the final plot that went viral looks like:
BONUS: Swipe My Code THIS TUTORIAL + 1 MORE DATA VISUALIZATION
Get the BONUS.
Want all the code I just showed you? And want to get +1 BONUS PLOT? Then swipe my R-tip library.
The code for the VIRAL PLOT + 1 BONUS PLOT are inside of R-Tip 067_types_of_data_professionals folder.
Need to advance your business data science skills?
I’ve helped 6,107+ students learn data science for business from an elite business consultant’s perspective.
I’ve worked with Fortune 500 companies like S&P Global, Apple, MRM McCann, and more.
And I built a training program that gets my students life-changing data science careers (don’t believe me? see my testimonials here):
6-Figure Data Science Job at CVS Health ($125K)
Senior VP Of Analytics At JP Morgan ($200K)
50%+ Raises & Promotions ($150K)
Lead Data Scientist at Northwestern Mutual ($175K)
2X-ed Salary (From $60K to $120K)
2 Competing ML Job Offers ($150K)
Promotion to Lead Data Scientist ($175K)
Data Scientist Job at Verizon ($125K+)
Data Scientist Job at CitiBank ($100K + Bonus)
Whenever you are ready, here’s the system they are taking:
Here’s the system that has gotten aspiring data scientists, career transitioners, and life long learners data science jobs and promotions…

Join My 5-Course R-Track Program Now!
(And Become The Data Scientist You Were Meant To Be...)
P.S. - Samantha landed her NEW Data Science R Developer job at CVS Health (Fortune 500). This could be you.
