K-Means Clustering in R the Tidy Way (Feat. Tidyclust)
Written by Matt Dancho
To be successful as a Data Scientist, you’re often put in positions where you need to find groups within your data. One key business use-case is finding clusters of customers that behave similarly. And that’s a powerful skill that I’m going to help you with today: It’s called Customer Segmentation with K-Means Clustering.
Table of Contents
Today you’re going to become better at clustering customers. Here’s what you’re learning today:
- What K-Means Clustering is (and why it’s absolutely essential to your data science career)
- How to use an amazing R package to make K-means clustering a breeze (and insantly improve your modeling workflow)
- Bonus: Steal my brand NEW data visualization code (for the Customer Segmentation Plot we make today)
SPECIAL ANNOUNCEMENT: AI for Data Scientists Workshop on December 18th
Inside the workshop I’ll share how I built a SQL-Writing Business Intelligence Agent with Generative AI:

What: GenAI for Data Scientists
When: Wednesday December 18th, 2pm EST
How It Will Help You: Whether you are new to data science or are an expert, Generative AI is changing the game. There’s a ton of hype. But how can Generative AI actually help you become a better data scientist and help you stand out in your career? I’ll show you inside my free Generative AI for Data Scientists workshop.
Price: Does Free sound good?
How To Join: 👉 Register Here
R-Tips Weekly
This article is part of R-Tips Weekly, a weekly video tutorial that shows you step-by-step how to do common R coding tasks. Pretty cool, right?
Here are the links to get set up. 👇
This Tutorial is Available in Video
I have a companion video tutorial that walks you through how to do the full K-Means Clustering Analysis and create the Marketing Cluster Plot. And, I’m finding that a lot of my students prefer the dialogue that goes along with video-based coding. So check out this video to see me running the R code in this tutorial. 👇
K-Means Clustering: What it is AND why it’s important
I remember in my days of working as the Director of Sales for Bonney Forge, a company that did roughly $400,000,000 per year selling valves and fittings to Energy companies. Bonney Forge had tons and tons of customers AND tons and tons of product SKUs. Each customer had different purchasing patterns AND because of this…
There was a big problem: we couldn’t easily target them for marketing campaigns.
Some customers would buy specific products for “Upstream” applications (where they pulled oil out of the ground). Some would purchase products for “Midstream”, or transmission from an oil patch to a refinery. And some would buy products for “Downstream”, focusing on refining the oil into useful products.
To make matters worse, some customers would have weird buying patterns where they’d buy only valves. And others would buy only fittings. And some would buy both. And, with over 1,000,000 SKUs, it became really tough to market to them. In fact, for the longest time we didn’t. And we lost out.
Enter K-Means Clustering
I needed a way to group our customers based on what they were buying in real time. The algorithm that showed the most promise was K-Means Clustering.
According to Wikipedia…
K-Means clustering is a method that aims to partition n observations into k clusters in which each observation belongs to the cluster with the nearest mean (cluster centers or cluster centroid), serving as a prototype of the cluster.
When the K-means algorithm converged, it found centers that minimized the “within-cluster variances” of the groups.

Convergence of K-Means (Source: Wikipedia)
The main challenge with K-means: how to pick K
Picking how many clusters (the value for “K”) is the toughest part. Nowadays there are more rigorous methods, but often in business data I had to test a few values (e.g. 4 to 8 clusters). Then I’d settle on the number of clusters that made the most business sense.
Other methods include the “Elblow Method” and the “Silhouette Method”. I won’t dive into those methods here. But you can find more detailed discussions on Wikipedia.
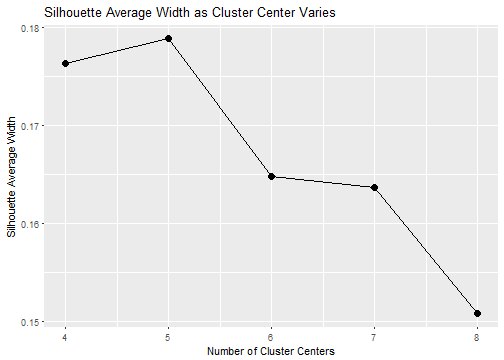
Example of a Silhoutte Plot for Picking Cluster Centers (Source: Business Science)
Armed with K-means, here’s what it did for me
So what did K-means get me? Well, it turns out that I didn’t know a lot about our customers. And running K-means gave me a better understanding of which customers behaved similarly.
This in and of itself wasn’t the end. But rather it helped me with a much larger project, which was customer lead scoring. Armed with K-means, I knew which products customers preferred. And combining with Lead Scoring, I could determine the probability of purchase.
And I used this information to develop a Lead Scoring System that grew our team’s revenue from $3,000,000 per year to $15,000,000 per year in about 2 years.
Even more remarkable, this was during 2014-2016 Oil Recession which was the time when Oil Prices dropped from $100 per barrel to $25 per barrel. And our company went through 4 rounds of layoffs.
This was the worst economic period in our company’s history. And, somehow I was promoted twice, doubled my salary (went from $80,000 per year –> $155,000 per year), and went from overseeing 5 people to 60+ people inside the organization.
So what did K-means really do for me?
K-means gave me job security. A common theme in data science: there was always more to be done. And each problem more often than not had a positive outcome financially. And even with a 5X growth, I was just scratching the surface with Data Science.
Had we used a marketing strategy that integrated customer purchasing behaviour, I guarantee there’s more growth we could have achieved. But such is life. I’ll take a 5X ROI. And my CEO was happy. I’ll take that too.
Ok, onto the K-means clustering tutorial…
Free Gift: Cheat Sheet for my Top 100 R Packages (Special Data Analysis Topics Included)
Before we dive in…
You’re going to need R packages to complete the data analysis that helps your company. So why not speed up the process?
To help, I’m going to share my secret weapon…
Even I forget which R packages to use from time to time. And this cheat sheet saves me so much time. Instead of googling to filter through 20,000 R packages to find a needle in a haystack. I keep my cheat sheet handy so I know which to use and when to use them. Seriously. This cheat sheet is my bible.
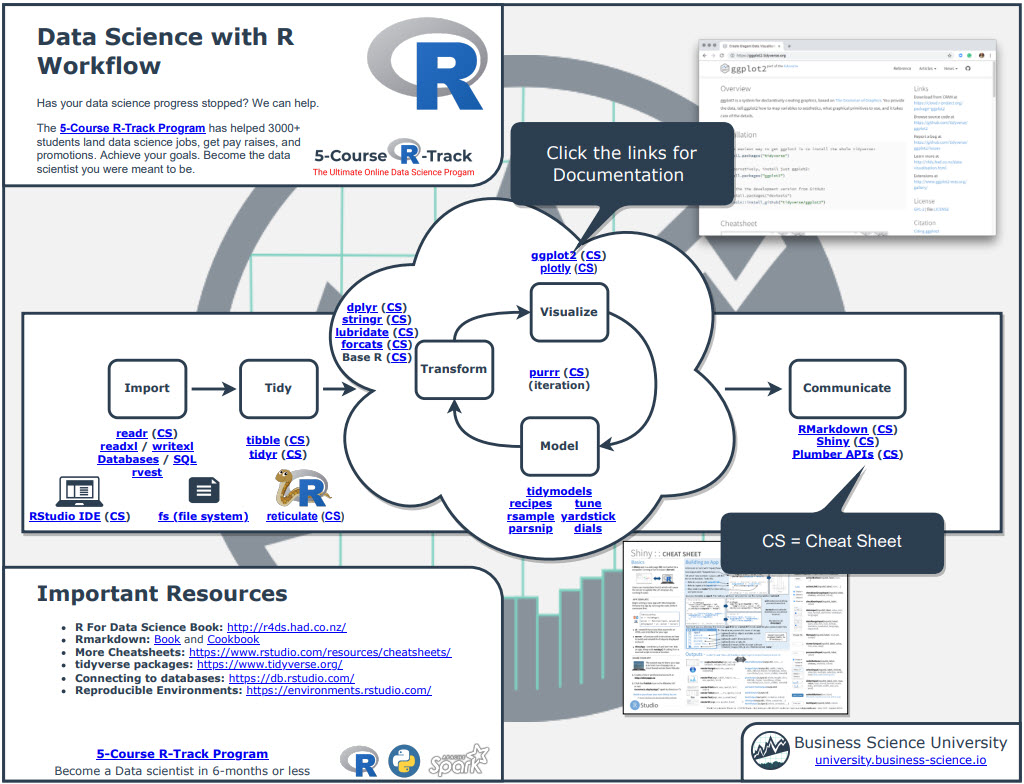
Once you download it, head over to page 3 and you’ll see several R packages I use frequently just for Data Analysis.
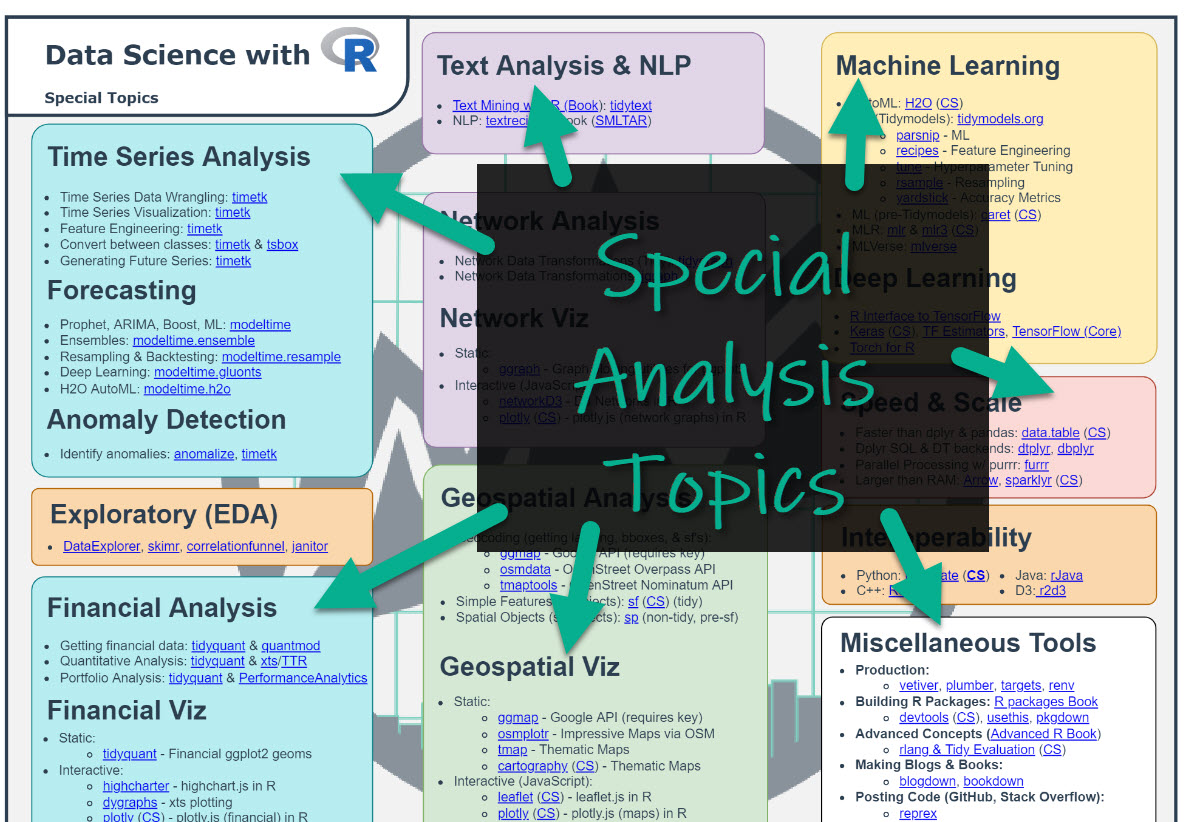
Which is important when you want to work in these fields:
- Machine Learning
- Time Series
- Financial Analysis
- Geospatial Analysis
- Text Analysis and NLP
- Shiny Web App Development
So steal my cheat sheet. It will save you a ton of time.
Tutorial: How to Cluster Customers with K-Means Clustering and tidyclust
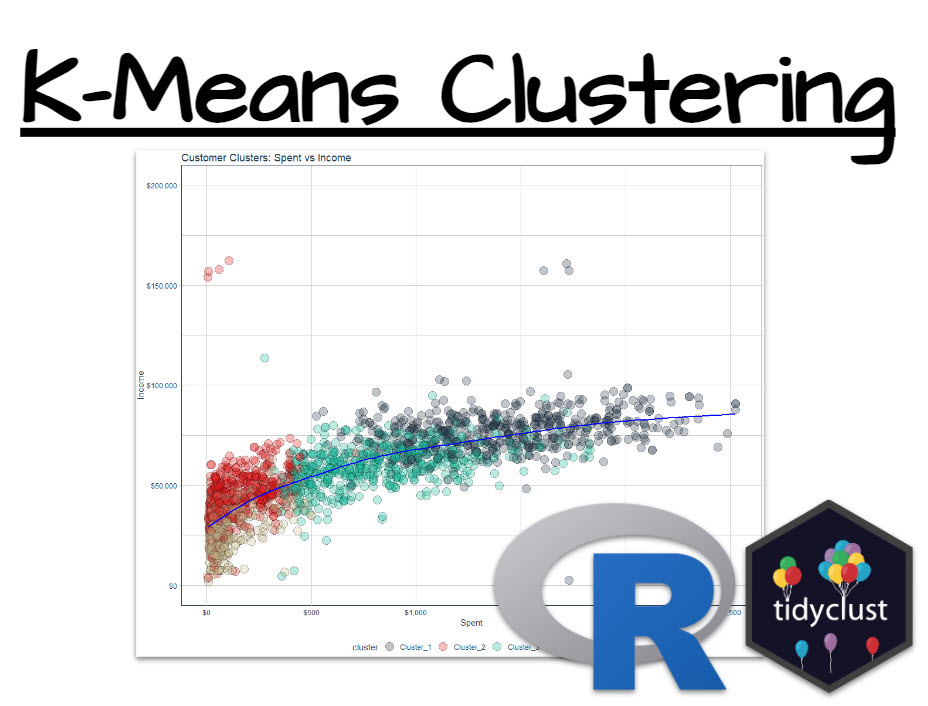
I’m going to share exactly how to make the customer segmentation that is shown in this Customer Segmentation Plot. And as a BONUS, I’ll share how you can get the Customer Segmentation Plot (both static and interactive versions) for FREE.
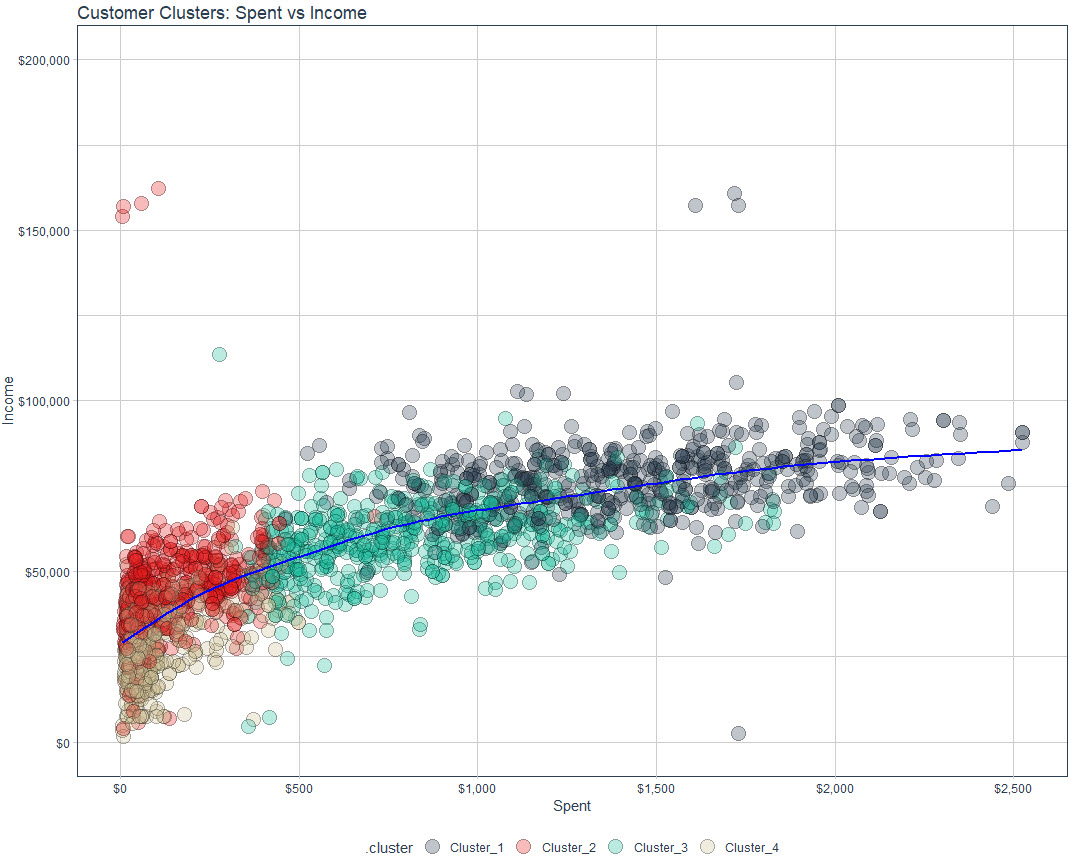
Customer Cluster Plot
Step 1: Get the Libraries and Data
First, load in the following libraries.
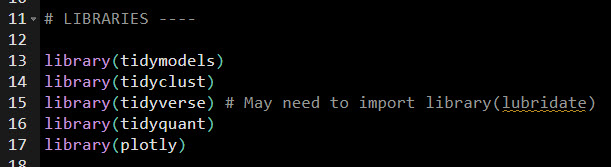
Steal my code.
The data is stored in a CSV file. We’ll read it in.
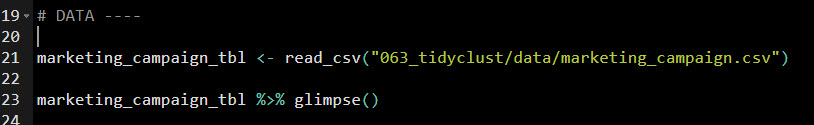
Steal my code.
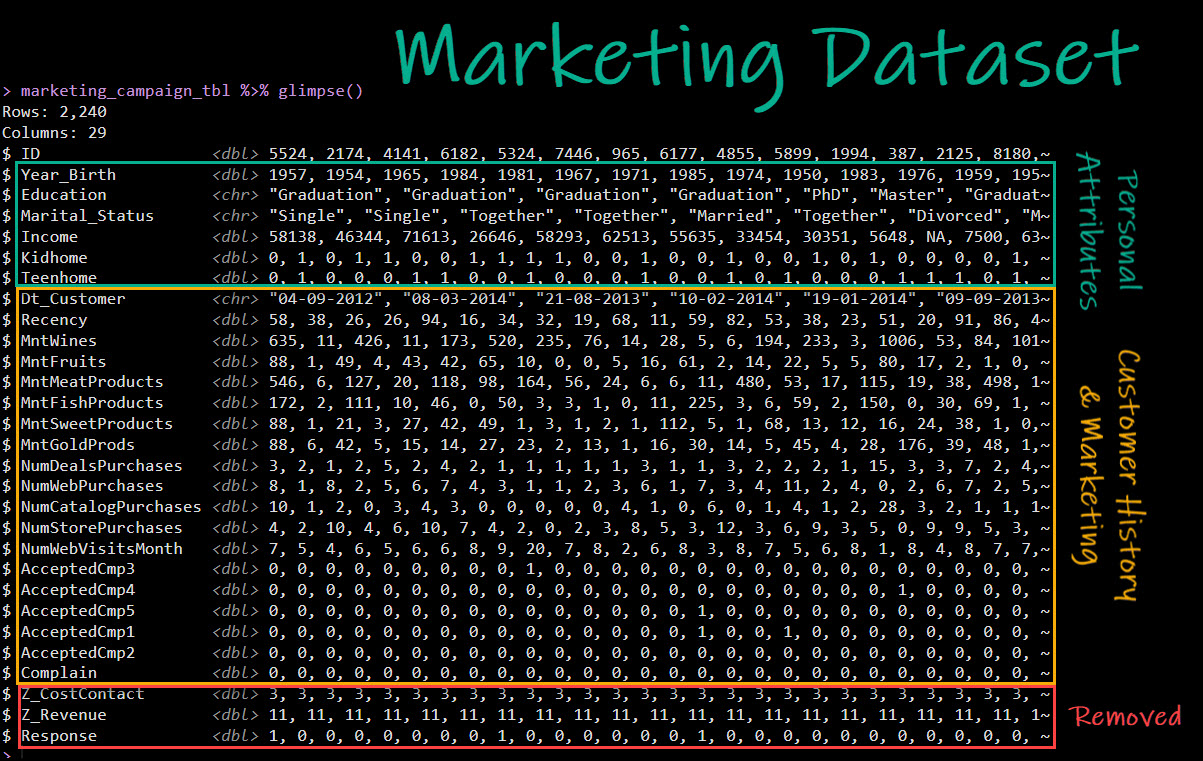
The raw marketing data is composed of 2,240 rows and 29 columns containing:
- Personal Attributes
- Customer History & Marketing Campaign Data
- Removed Columns
Get the Marketing Dataset.
Step 2: Prepare the Data
In this step, we need to get the dataset ready for modeling with K-means. To do so, we will:
- Remove
NA values (could also impute)
- Add a feature,
Dt_Customer_Age that identifies how long the customer has been with the company (and remove the Dt_Customer feature)
- Add a feature,
Spent that calculates the Customer’s total spend
- Remove features we don’t want to influence the grouping
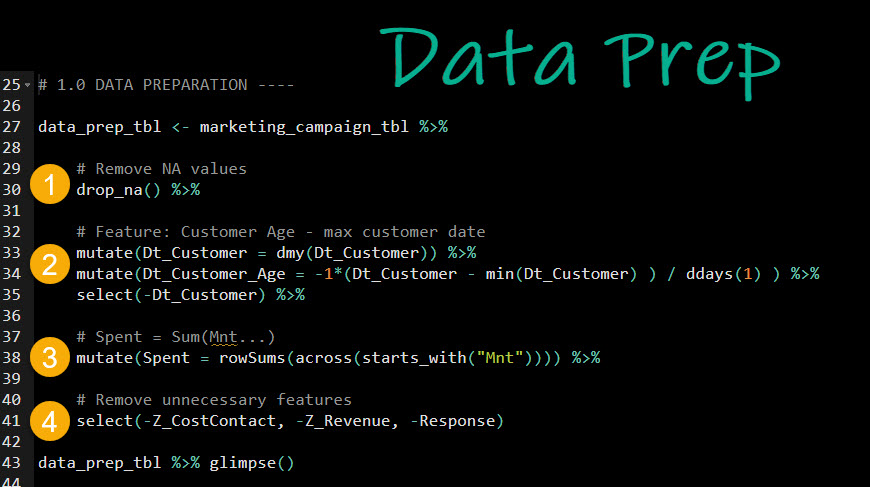
Steal my code.
The prepared dataset looks like this:
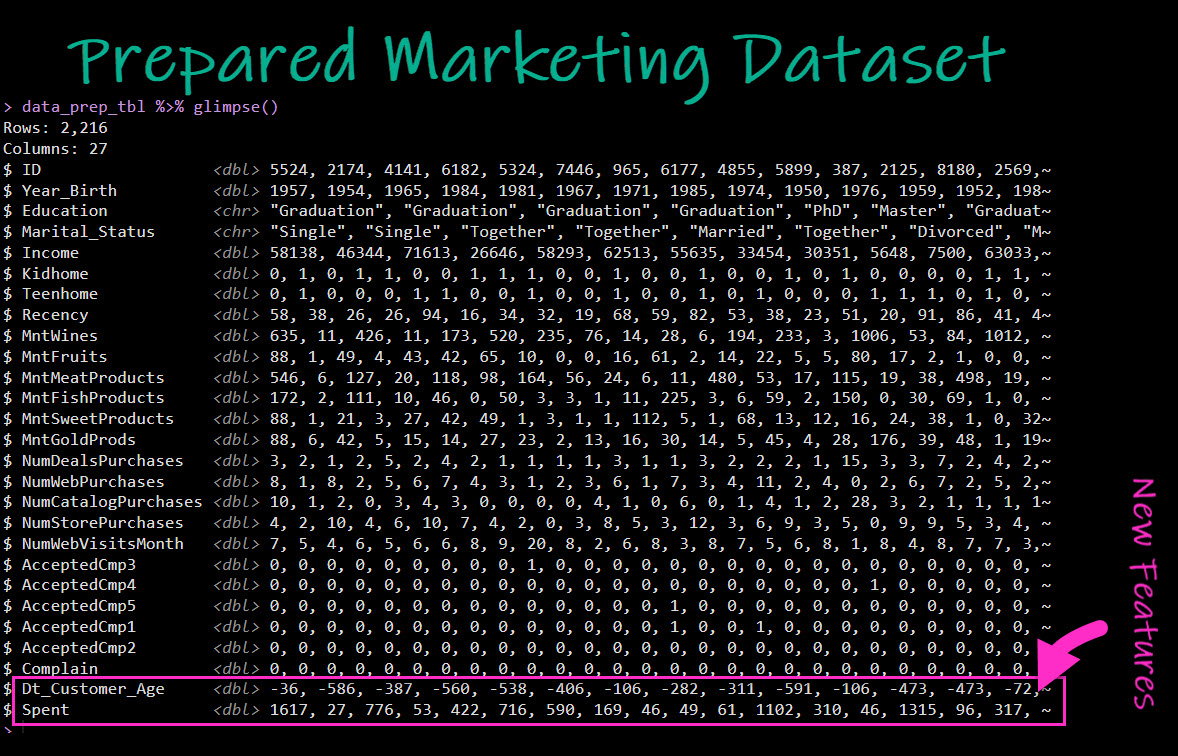
Steal my code.
Step 3: Preprocess the Data with recipes
Next, we will use recipes to further preprocess the data:
- One-hot encoding character and categorical data
- Scaling & center all numeric data to mean zero and standard deviation 1 (also called normalizing)
- Removing the “ID” feature (not predictive)
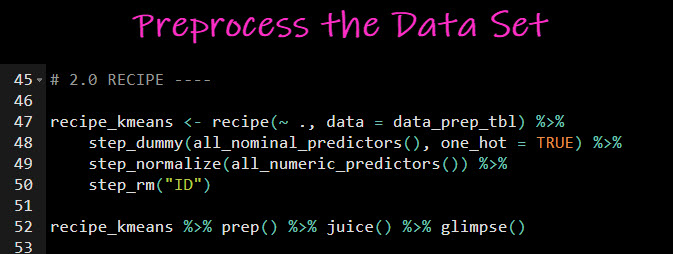
Steal my code.
The transformation when applied looks like this:
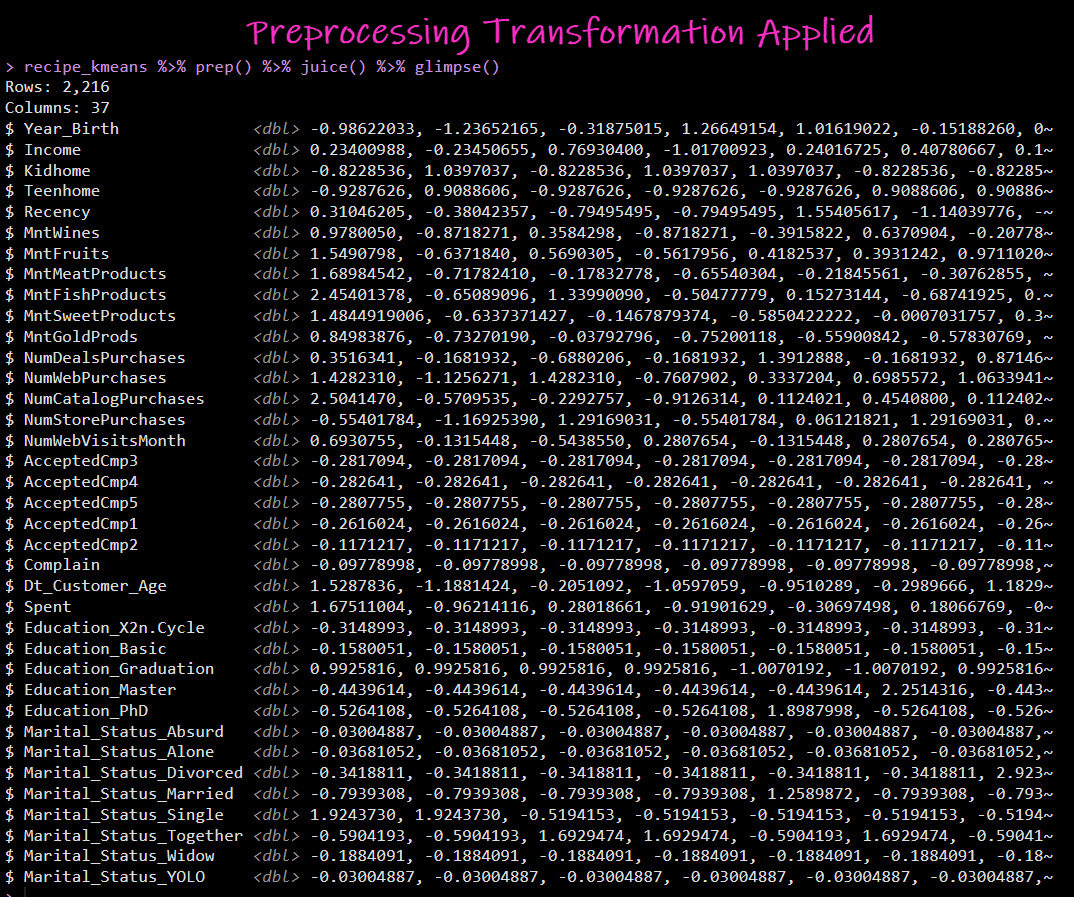
Steal my code.
Step 4: K-Means Clustering (feat. tidyclust + tidymodels)
Next, I’ll perform K-Means Clustering using tidyclust and tidymodels:
- Make a K-Means Model. Be sure to identify the number of clusters.
- Train the K-means Model (using a Tidymodels Workflow that combines the model, recipe, and fits to the prepared data.)
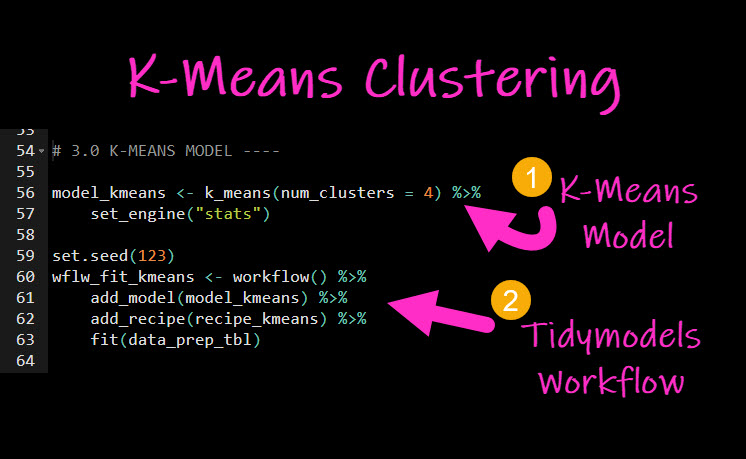
Steal my code.
With a trained (fitted) model, we can get the clusters with predict():
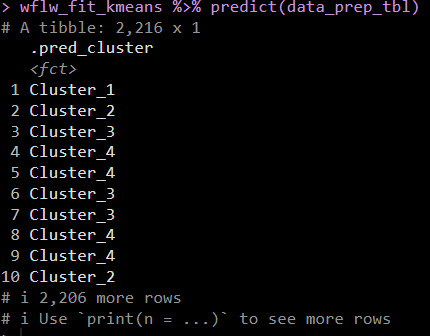
Steal my code.
BONUS: Steal My Customer Segmentation Library + Visualization Code for this R-Tip
Want all the code I just showed you? Steal my R-tip library.
The code for the K-means PLUS the visualization code are inside of R-Tip 063_tidyclust.
Steal code library from this tutorial.
Need to advance your business data science skills?
I’ve helped 6,107+ students learn data science for business from an elite business consultant’s perspective.
I’ve worked with Fortune 500 companies like S&P Global, Apple, MRM McCann, and more.
And I built a training program that gets my students life-changing data science careers (don’t believe me? see my testimonials here):
6-Figure Data Science Job at CVS Health ($125K)
Senior VP Of Analytics At JP Morgan ($200K)
50%+ Raises & Promotions ($150K)
Lead Data Scientist at Northwestern Mutual ($175K)
2X-ed Salary (From $60K to $120K)
2 Competing ML Job Offers ($150K)
Promotion to Lead Data Scientist ($175K)
Data Scientist Job at Verizon ($125K+)
Data Scientist Job at CitiBank ($100K + Bonus)
Whenever you are ready, here’s the system they are taking:
Here’s the system that has gotten aspiring data scientists, career transitioners, and life long learners data science jobs and promotions…

Join My 5-Course R-Track Program Now!
(And Become The Data Scientist You Were Meant To Be...)
P.S. - Samantha landed her NEW Data Science R Developer job at CVS Health (Fortune 500). This could be you.
