How to Analyze Your Data Faster With R Using summarytools
Written by Matt Dancho
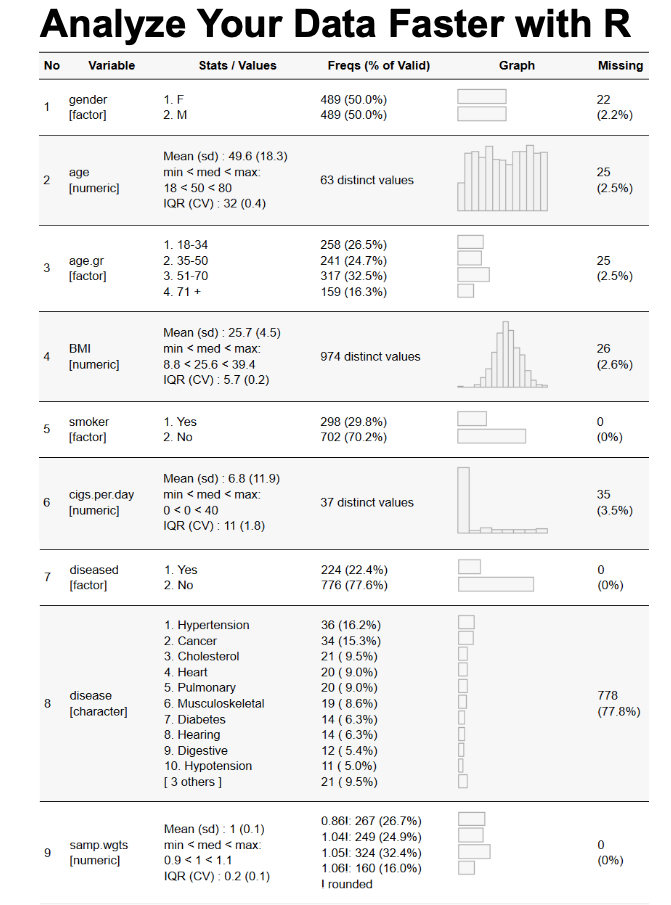
Hey guys, welcome back to my R-tips newsletter. Getting quick insights into your data is absolutely critical to data understanding, predictive modeling, and production. But it can be challenging if you’re just getting started. Today, I’m going to show you how to analyze your data faster using the summarytools package in R. Let’s go!
Table of Contents
Here’s what you’re learning today:
- Why Quick Data Analysis is Important
- How to Use
summarytools to Summarize Your Data
- Data Frame Summaries with
dfSummary()
- Descriptive Statistics with
descr()
- Frequency Tables with
freq()
- Next Steps: Join the R-Tips Newsletter to get the code and stay updated.

Get the Code (In the R-Tip 084 Folder)
SPECIAL ANNOUNCEMENT: AI for Data Scientists Workshop on December 18th
Inside the workshop I’ll share how I built a SQL-Writing Business Intelligence Agent with Generative AI:
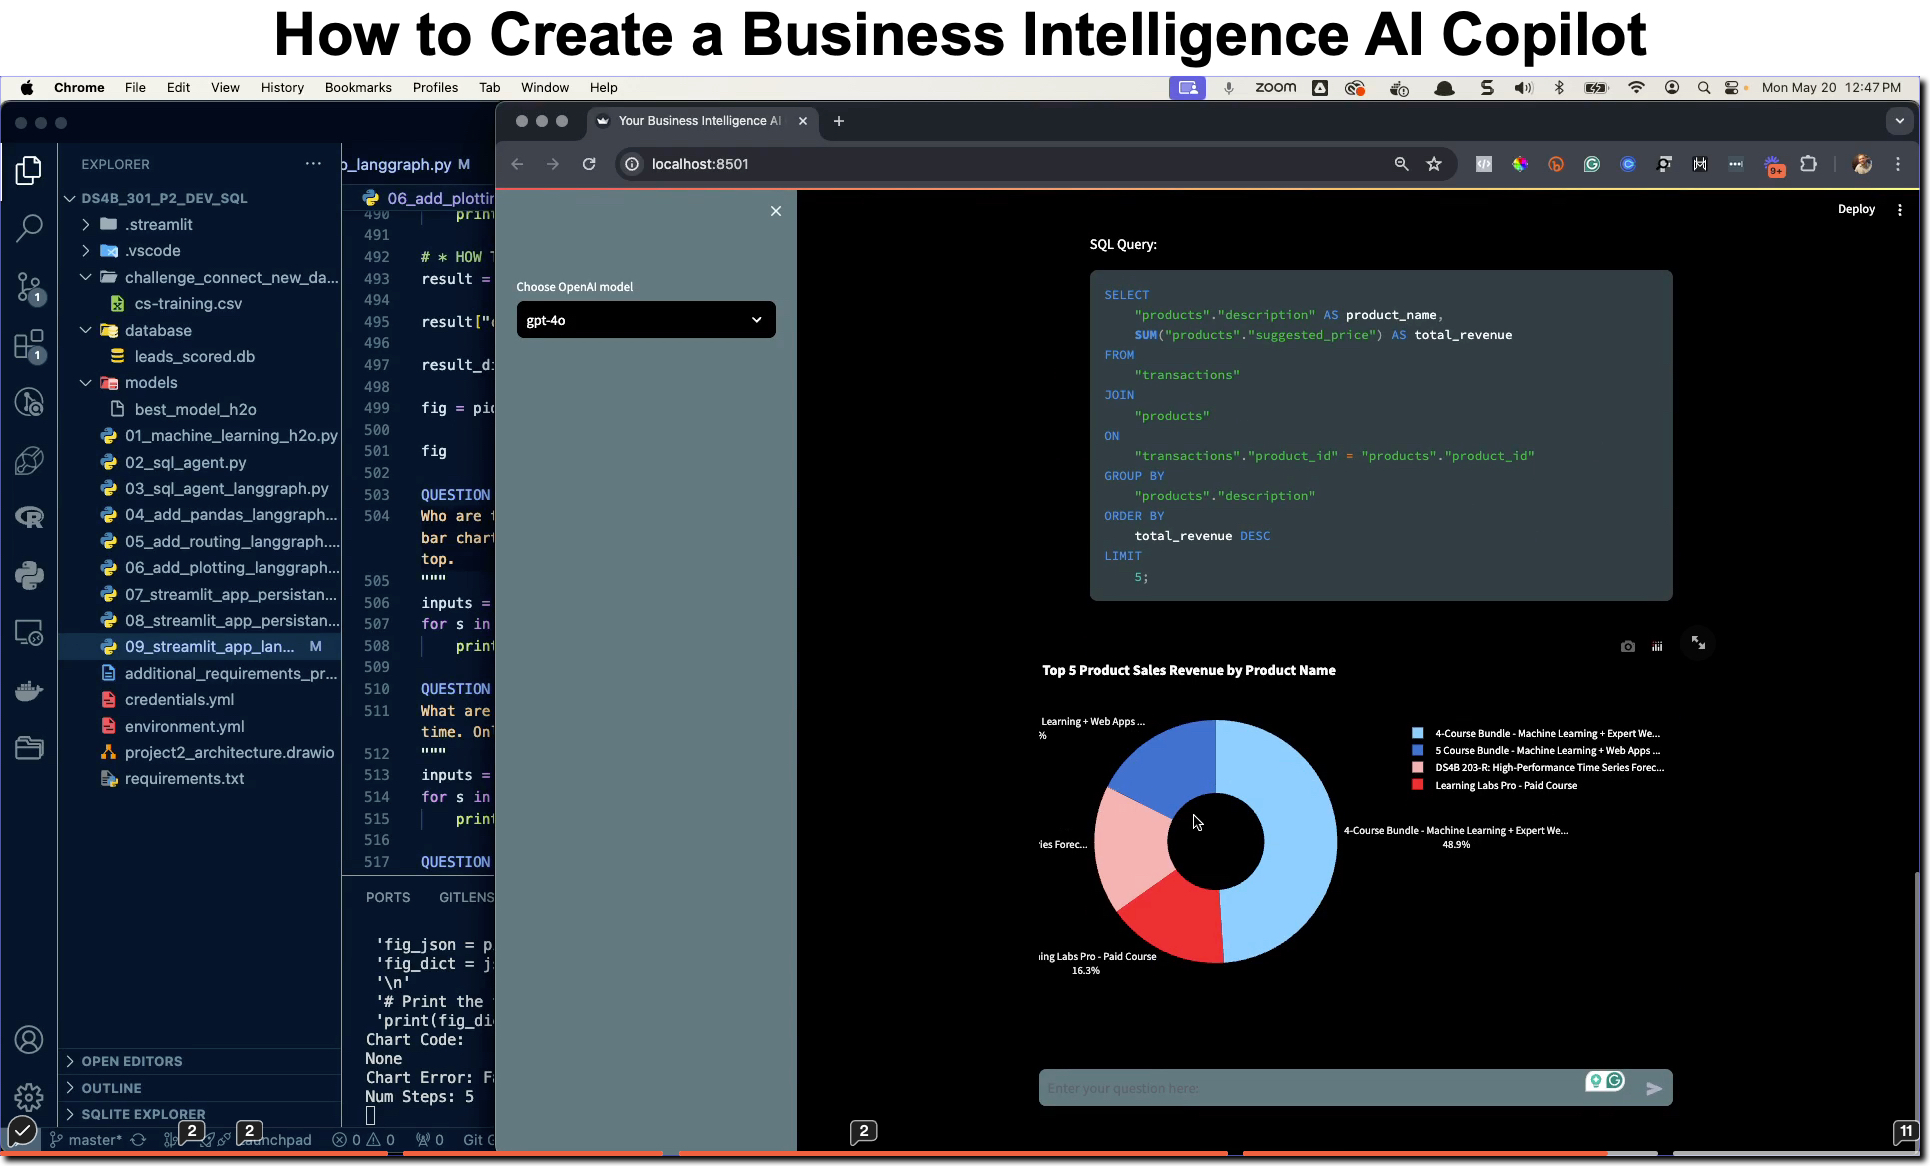
What: GenAI for Data Scientists
When: Wednesday December 18th, 2pm EST
How It Will Help You: Whether you are new to data science or are an expert, Generative AI is changing the game. There’s a ton of hype. But how can Generative AI actually help you become a better data scientist and help you stand out in your career? I’ll show you inside my free Generative AI for Data Scientists workshop.
Price: Does Free sound good?
How To Join: 👉 Register Here
R-Tips Weekly
This article is part of R-Tips Weekly, a weekly video tutorial that shows you step-by-step how to do common R coding tasks. Pretty cool, right?
Here are the links to get set up. 👇
This Tutorial is Available in Video (6-minutes)
I have a 6-minute video that walks you through setting up summarytools in R and running your first exploratory data analysis with it. 👇
Why Quick Data Analysis is Important
In the fast-paced world of data science, getting quick insights into your data is crucial. It allows you to understand your data better, make informed decisions, and expedite the modeling process. However, performing exploratory data analysis (EDA) can be time-consuming if you’re not using the right tools.
The summarytools package in R simplifies the process of data exploration by providing functions that generate comprehensive summaries of your data with minimal code.
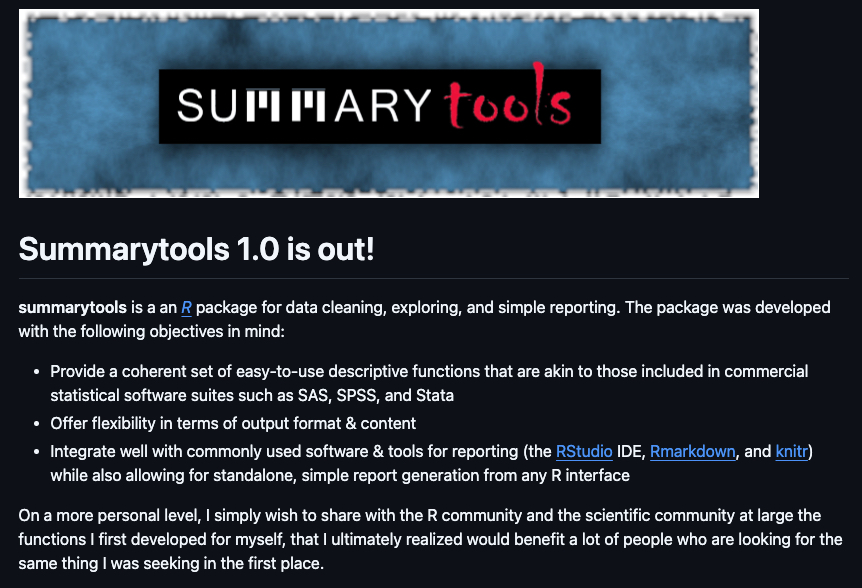
Let’s dive into how you can use summarytools to speed up your data analysis.
I’ll show off some of the most important functionality in summarytools. I’ll use a customer churn dataset. You can get all of the data and code here (it’s in the R-Tip 084 Folder).
Step 1: Load Libraries and Data
First, make sure you have the summarytools and tidyverse packages installed. Then load the libraries and data needed to complete this tutorial.

Get the Data and Code (In the R-Tip 084 Folder)
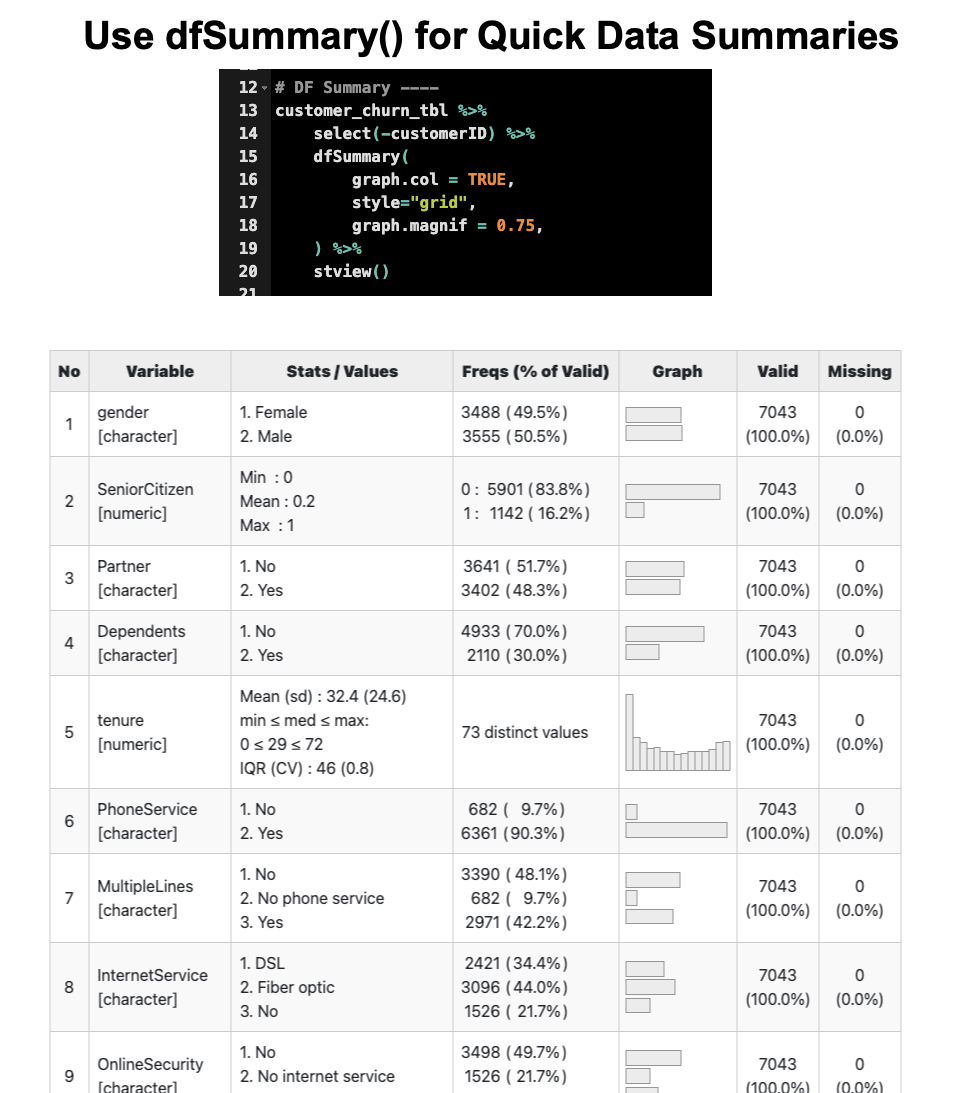
Step 2: Data Frame Summaries with dfSummary()
The dfSummary() function provides a detailed summary of your data frame, including:
- Data types
- Missing values
- Unique values
- Basic statistics
- Graphical representations
This code will open an interactive HTML report that summarizes your entire data frame, making it easy to spot anomalies or areas that need attention. Run this code:
Get the Code (In the R-Tip 084 Folder)
Step 3: Descriptive Statistics with descr()
To get descriptive statistics for your numeric variables, use the descr() function. This function provides detailed statistics such as:
- Mean
- Median
- Standard deviation
- Inner quartile range (IQR)
- Min
- Max
- Skewness
- Kurtosis
Run this code:
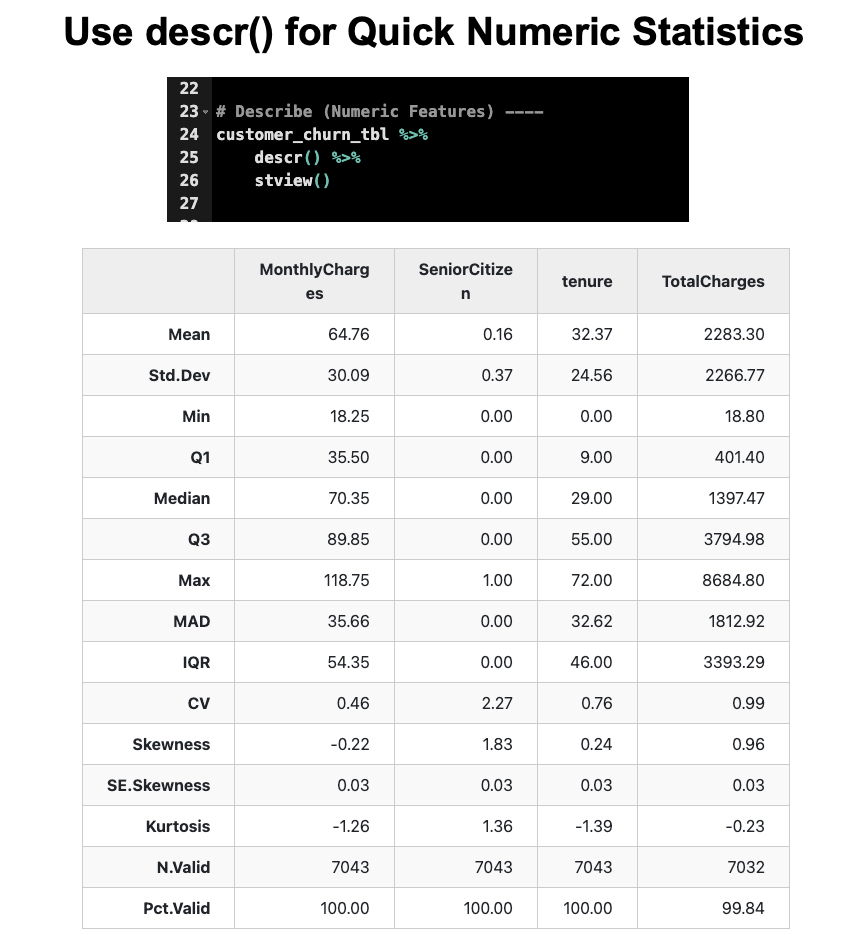
Get the Code (In the R-Tip 084 Folder)
Step 4: Frequency Tables with freq()
For categorical variables, the freq() function generates frequency tables that show the distribution of categories. This helps you understand the distribution and prevalence of each category within your data.
Run this code:
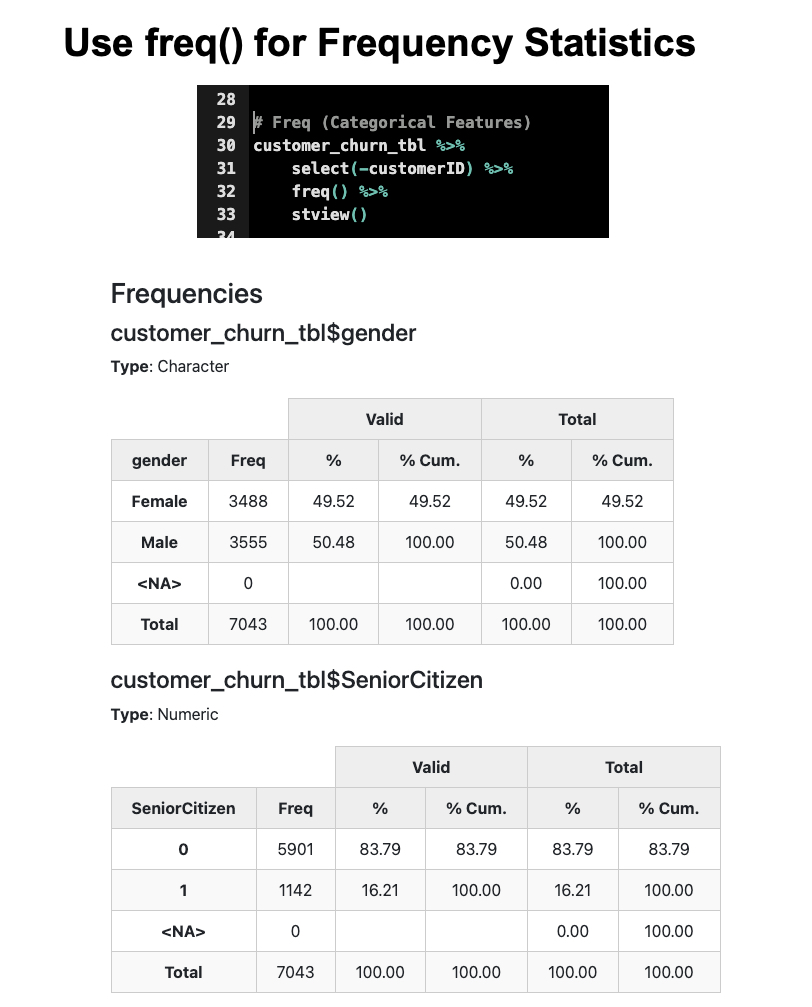
Get the Code (In the R-Tip 084 Folder)
Conclusions:
By leveraging the summarytools package, you can perform a comprehensive exploratory data analysis with just a few lines of code. This not only saves you time but also enhances your understanding of the data, allowing you to make better-informed decisions. This leads to better predictive modeling, exploratory data analysis, and production deployment.
But there’s more to becoming a data scientist.
If you would like to grow your Business Data Science skills with R, then please read on…
Need to advance your business data science skills?
I’ve helped 6,107+ students learn data science for business from an elite business consultant’s perspective.
I’ve worked with Fortune 500 companies like S&P Global, Apple, MRM McCann, and more.
And I built a training program that gets my students life-changing data science careers (don’t believe me? see my testimonials here):
6-Figure Data Science Job at CVS Health ($125K)
Senior VP Of Analytics At JP Morgan ($200K)
50%+ Raises & Promotions ($150K)
Lead Data Scientist at Northwestern Mutual ($175K)
2X-ed Salary (From $60K to $120K)
2 Competing ML Job Offers ($150K)
Promotion to Lead Data Scientist ($175K)
Data Scientist Job at Verizon ($125K+)
Data Scientist Job at CitiBank ($100K + Bonus)
Whenever you are ready, here’s the system they are taking:
Here’s the system that has gotten aspiring data scientists, career transitioners, and life long learners data science jobs and promotions…

Join My 5-Course R-Track Program Now!
(And Become The Data Scientist You Were Meant To Be...)
P.S. - Samantha landed her NEW Data Science R Developer job at CVS Health (Fortune 500). This could be you.
