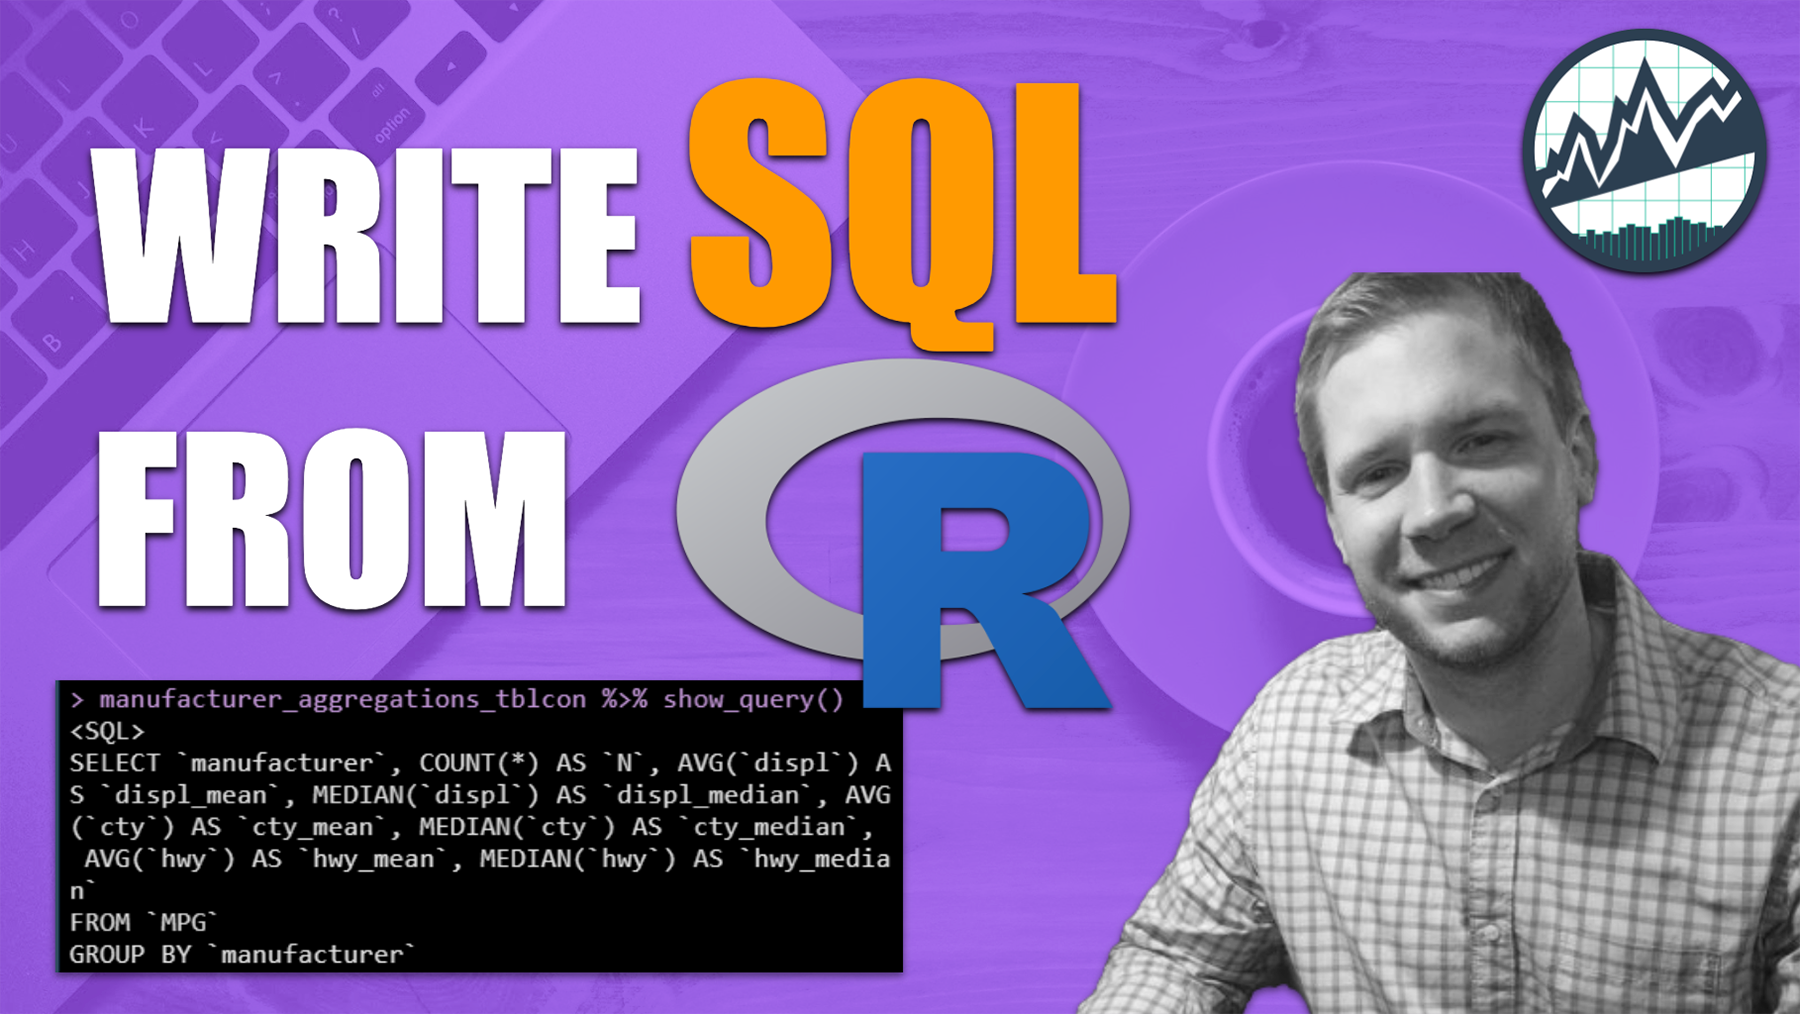
How to Write SQL From R
Written by Matt Dancho
The problem with SQL is that there are so many “flavors” (every database has it’s own version of SQL and they are different). And, remembering how to do simple things in SQL can be a huge pain. What if I told you there was an easier way? There is!
Table of Contents
Today I’m going to show you how you can write SQL from R. Here’s what you’re learning today:
- Tutorial: Write SQL from R and query the database (without writing any SQL code)
- Bonus: Formatting SQL like a SQL expert
Get the code.
SPECIAL ANNOUNCEMENT: AI for Data Scientists Workshop on December 18th
Inside the workshop I’ll share how I built a SQL-Writing Business Intelligence Agent with Generative AI:

What: GenAI for Data Scientists
When: Wednesday December 18th, 2pm EST
How It Will Help You: Whether you are new to data science or are an expert, Generative AI is changing the game. There’s a ton of hype. But how can Generative AI actually help you become a better data scientist and help you stand out in your career? I’ll show you inside my free Generative AI for Data Scientists workshop.
Price: Does Free sound good?
How To Join: 👉 Register Here
R-Tips Weekly
This article is part of R-Tips Weekly, a weekly video tutorial that shows you step-by-step how to do common R coding tasks. Pretty cool, right?
Here are the links to get set up. 👇
This Tutorial is Available in Video
I have a companion video tutorial that shows even more secrets (plus mistakes to avoid). And, I’m finding that a lot of my students prefer the dialogue that goes along with coding. So check out this video to see me running the code in this tutorial. 👇
Writing SQL from R
Get the code.
We’re going to generate SQL from R using 3 key packages:
DBI - For connecting to & working with databasesRSQLite - For working with the SQLite-variety of databasetidyverse - Gives us dbplyr - the database-backened to dplyr - FOR FREE!! OMG!
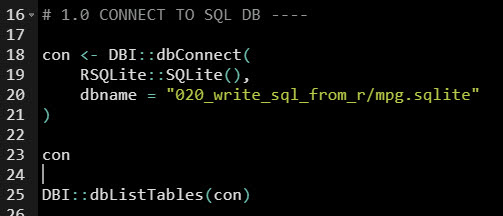
Step 1: Connect to database
Use DBI to make a connection
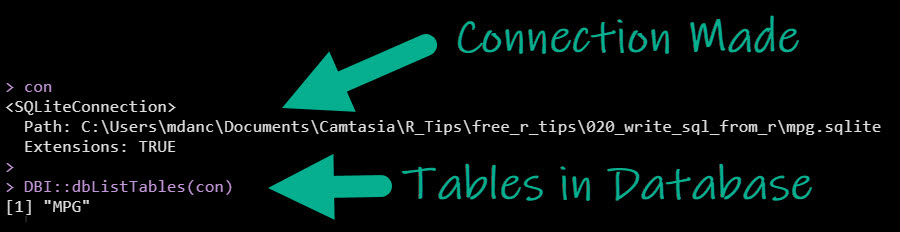
DBI has the dbConnect() function. Let’s use this to establish a connection with our SQL database.
Get the code.
Examine the connection. You should see a connection object has been created and the SQL database has one table named “MPG”.
Get the code.
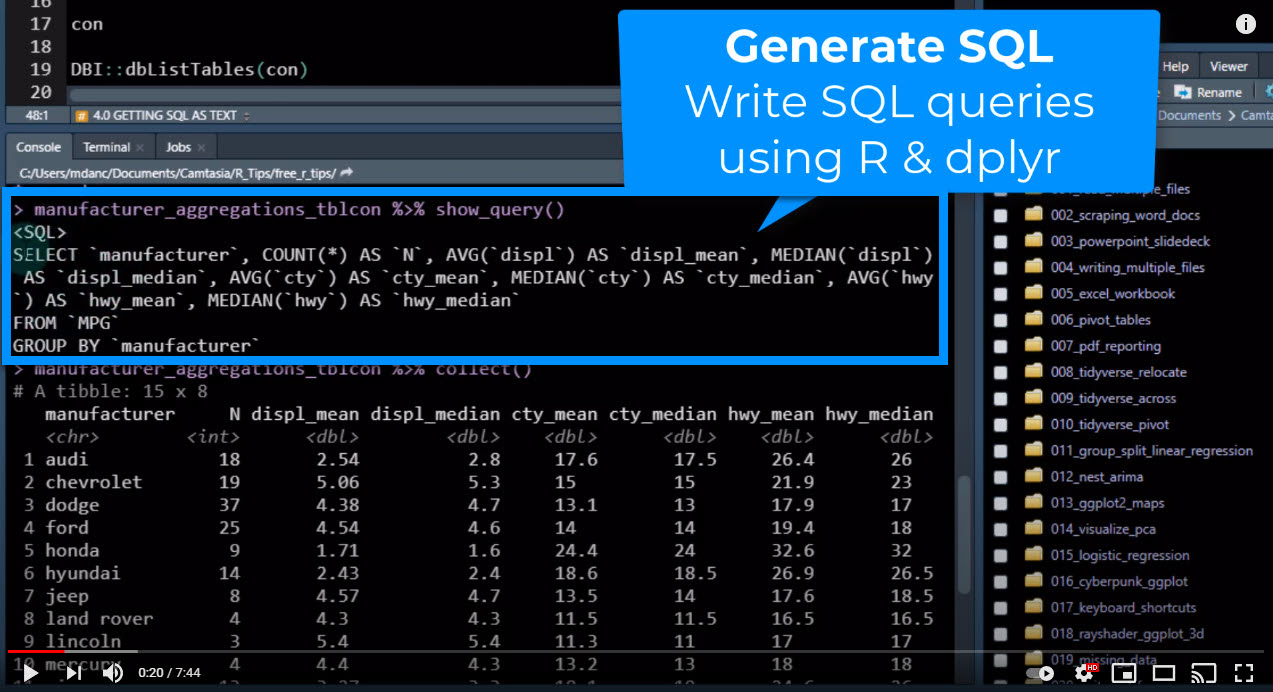
Step 2: Write Dplyr, Generate SQL
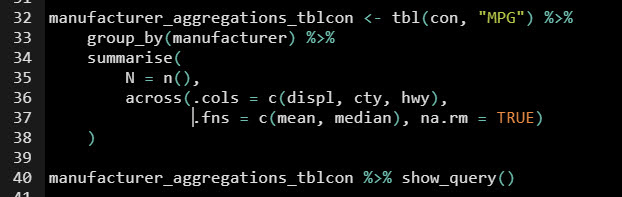
Use the dbplyr backend to auto-magically create SQL for us.
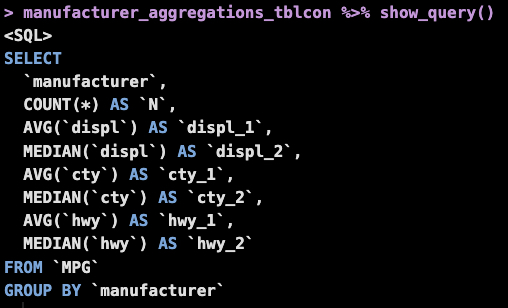
DBI has the show_query() function we can use to generate SQL…
Get the code.
…and here’s the result! See how the SQL query using show_query() is automatically formatted. Amazing.
(And now your boss thinks you’re an expert in SQL.)
💡 Conclusions
You learned how to write SQL from R, connect to a database and query it all from the compfort of R and dplyr. Great work! But, there’s a lot more to becoming a data scientist.
If you’d like to become a Business Scientist (and have an awesome career, improve your quality of life, enjoy your job, and all the fun that comes along), then I can help with that.
Need to advance your business data science skills?
I’ve helped 6,107+ students learn data science for business from an elite business consultant’s perspective.
I’ve worked with Fortune 500 companies like S&P Global, Apple, MRM McCann, and more.
And I built a training program that gets my students life-changing data science careers (don’t believe me? see my testimonials here):
6-Figure Data Science Job at CVS Health ($125K)
Senior VP Of Analytics At JP Morgan ($200K)
50%+ Raises & Promotions ($150K)
Lead Data Scientist at Northwestern Mutual ($175K)
2X-ed Salary (From $60K to $120K)
2 Competing ML Job Offers ($150K)
Promotion to Lead Data Scientist ($175K)
Data Scientist Job at Verizon ($125K+)
Data Scientist Job at CitiBank ($100K + Bonus)
Whenever you are ready, here’s the system they are taking:
Here’s the system that has gotten aspiring data scientists, career transitioners, and life long learners data science jobs and promotions…

Join My 5-Course R-Track Program Now!
(And Become The Data Scientist You Were Meant To Be...)
P.S. - Samantha landed her NEW Data Science R Developer job at CVS Health (Fortune 500). This could be you.
