New Course Content: DS4B 201 Chapter 7, The Expected Value Framework For Modeling Churn With H2O
Written by Matt Dancho
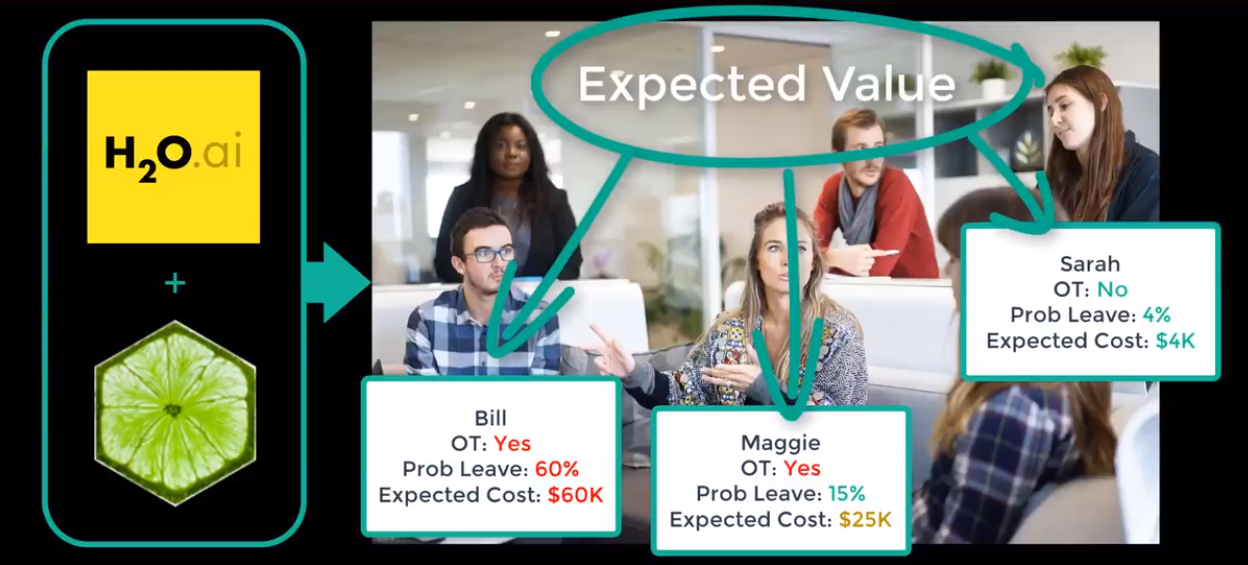
I’m pleased to announce that we released brand new content for our flagship course, Data Science For Business (DS4B 201). Over the course of 10 weeks, the DS4B 201 course teaches students and end-to-end data science project solving Employee Churn with R, H2O, & LIME. The latest content is focused on transitioning from modeling Employee Churn with H2O and LIME to evaluating our binary classification model using Return-On-Investment (ROI), thus delivering business value. We do this through application of a special tool called the Expected Value Framework. Let’s learn about the new course content available now in DS4B 201, Chapter 7, which covers the Expected Value Framework for modeling churn with H2O!
Related Articles On Applying Data Science To Business
If you’re interested in learning data science for business and topics discussed in the article (the expected value framework and the Business Science Problem Framework (BSPF)), check out some of these articles.
Learning Trajectory
We’ll touch on the following topics in this article:
Alright, let’s get started!
Get The Best Resources In Data Science. Every Friday!
Sign up for our free "5 Topic Friday" Newsletter. Every week, I'll send you the five coolest topics in data science for business that I've found that week. These could be new R packages, free books, or just some fun to end the week on.
Sign Up For Five-Topic-Friday!
Where We Came From (DS4B 201 Chapters 1-6)
Data Science For Business (DS4B 201) is the ultimate machine learning course for business. Over the course of 10 weeks, the student learns from and end-to-end data science project involving a major issue impacting organizations: Employee Churn. The student:
-
Learns tools to size the Business Problem, to communicate with Executives and C-Suite, and to integrate data science results financially, which is how the organization benefits.
-
Follows our BSPF systematic data science for business framework (the Business Science Problem Framework, get it here, learn about it here)
-
Uses advanced tools including H2O Automated Machine Learning and LIME Feature Explanation (learn about them here)
-
Applies cutting-edge data science using the tidyverse, builds custom functions with Tidy Eval, and implements a host of other packages including fs, recipes, skimr, GGally, cowplot, and more in as you complete an integrated data science project.
Chapter-By-Chapter Breakdown:
“The ultimate machine learning course for business!”
-
Chapter 0, Getting Started: The student learns how to calculate the true cost of employee attrition, which is a hidden cost (indirect) because lost productivity doesn’t hit the financial statements. The student then learns about the tools in our toolbox including the integrated BSPF + CRISP-DM data science project framework for applying data science to business.
-
Chapter 1, Business Understanding: BSPF And Code Workflows: From here-on-out, lectures are 95% R code. The student begins his/her transition into sizing the problem financially using R code. The student creates his/her first custom function using Tidy Eval and develops custom plotting functions with ggplot2 to financially explain turnover by department and job role.
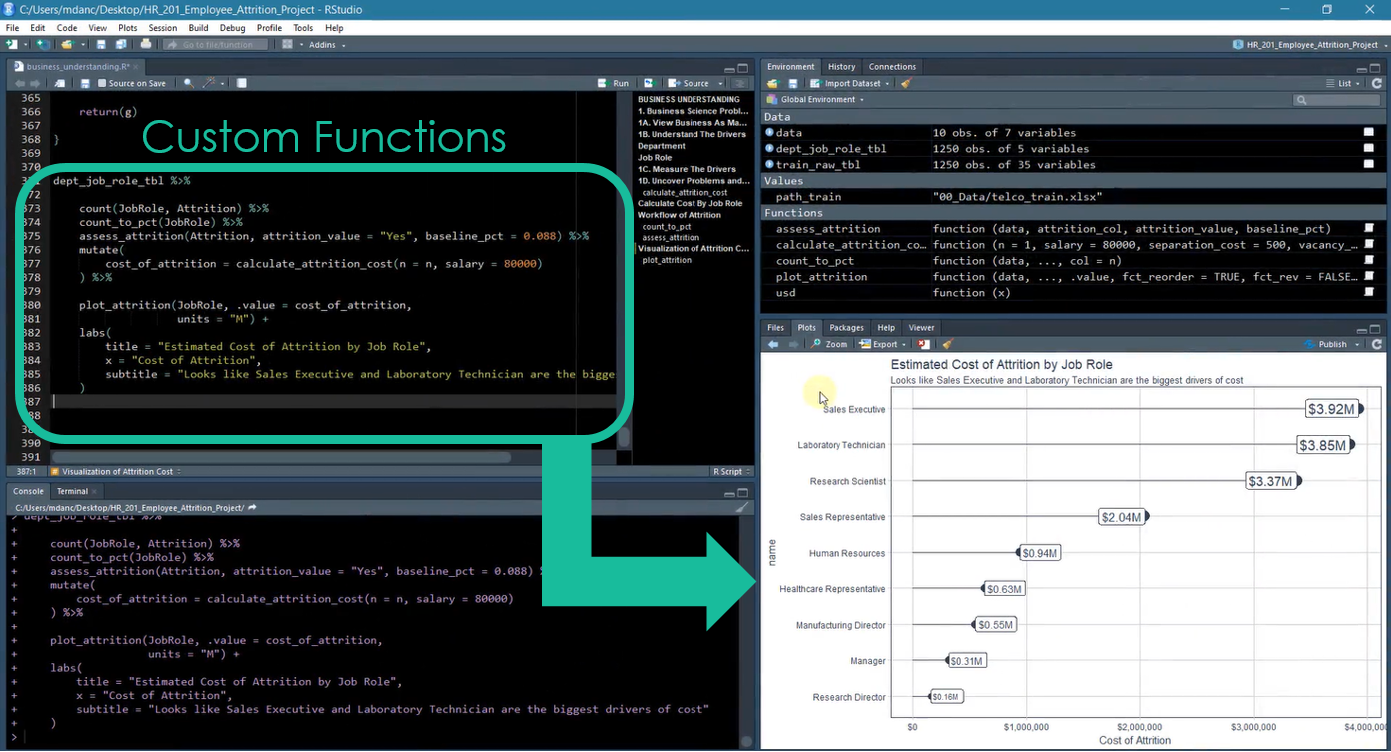
Chapter 1: Code Workflow and Custom Functions for Understanding the Size of the Problem
-
Chapter 2, Data Understanding: By Data Type And Feature-Target Interactions: The student learns two methods for Exploratory Data Analysis (EDA). The first is exploration by data type using the skimr package. The second is visualizing the Feature-Target Interactions using GGally.
-
Chapter 3, Data Preparation: Getting Data Ready For People And Machines: The student first learns about wrangling and merging data using map() and reduce() to create a preprocessing pipeline for the human-readable data format. Next the student uses the recipes package to prepare the data for a pre-modeling Correlation Analysis. The pre-modeling Correlation Analysis is performed to tell us if we’re ready to move into Modeling.
-
Chapter 4, Modeling Churn: Using Automated Machine Learning With H2O: This is the first of two chapters on H2O. The student learns how to use h2o.automl() to generate an H2O Leaderboard containing multiple models including deep learning, stacked ensembles, gradient boosted machine, and more!
-
Chapter 5, Modeling Churn: Assessing H2O Performance: The student works with the h2o.performance() function output using various H2O performance functions. The student then learns how to measure performance for different audiences. The ROC Plot and Precision Vs Recall Plots are developed for data scientist evaluation. The Cumulative Gain and Lift Plots are built for executive / C-suite evaluation. The student ends this chapter building the “Ultimate Model Performance Comparison Dashboard” for evaluating multiple H2O models.
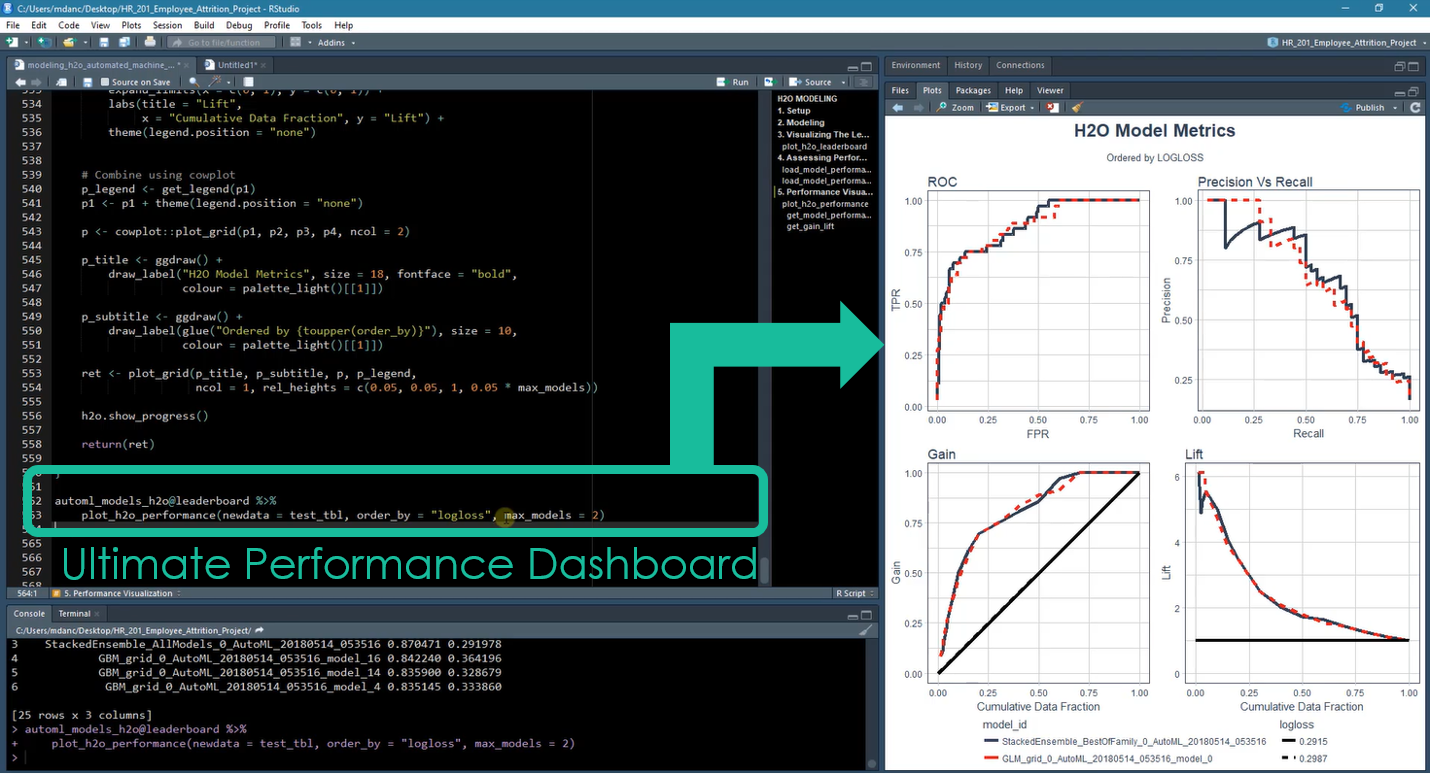
Chapter 5: Ultimate Performance Dashboard for Comparing H2O Models
- Chapter 6, Modeling Churn: Explaining Black-Box Models With
LIME: Prediction is important, but it’s even more important in business to understand why employees are leaving. In this chapter, students learn LIME, a useful package for explaining deep learning and stacked ensembles, which often have the best performance.
OK, now that we understand where we’ve been, let’s take a sneak peek at the new content!
New Content (Chapter 7): Calculating The Expected ROI (Savings) Of A Policy Change
This is where the rubber meets the road with ROI-Driven Data Science! You’ll learn how to use the Expected Value Framework to calculate savings for two policy changes:
Here’s the YouTube Video of the Expected Value Framework for Delivering ROI.
Students implement two overtime reduction policies. The first is a “No Overtime Policy”, which results in a 13% savings versus the baseline (do nothing). The second is a “Targeted Overtime Reduction Policy”, which increased the savings to 16% versus the baseline (do nothing). The targeted policy is performed using the F1 score showing the performance boost over a “Do Nothing Policy” and the “No Overtime Policy”.
The targeted policy requires working with the expected rates. It’s an un-optimized strategy that treats the true positives and true negatives equally (uses the F1 score, which does not account for business costs of false negatives). This occurs at a threshold of 28%, which can be seen in the Expected Rates graph below.
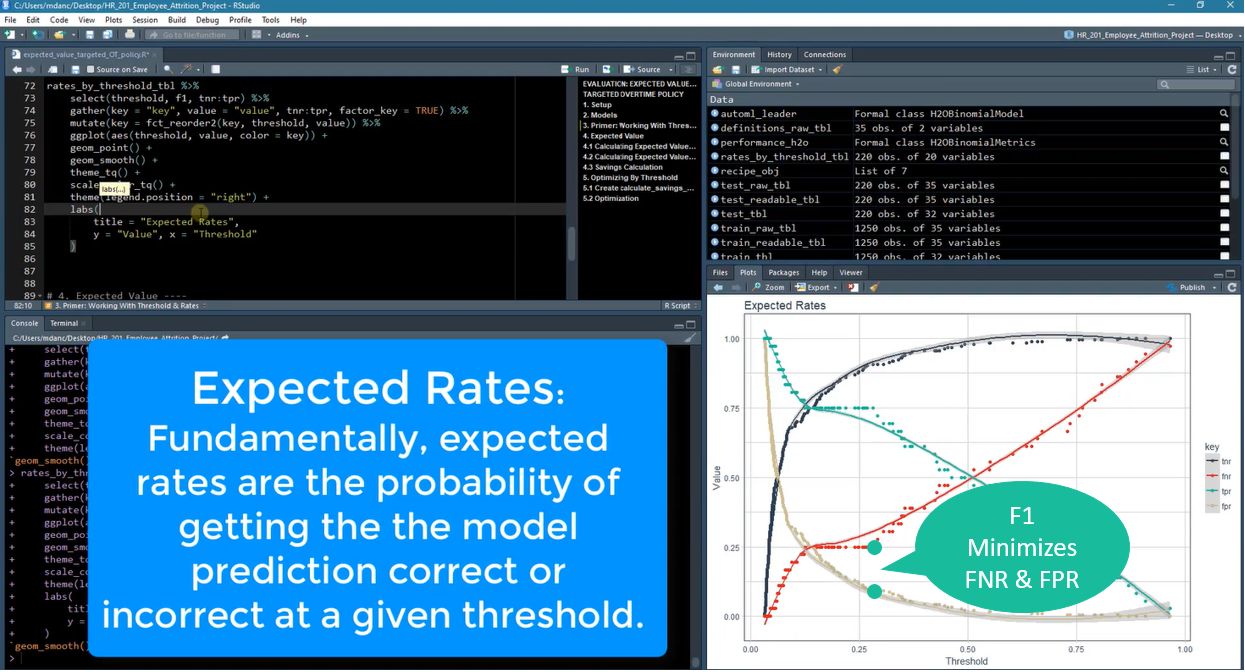
Chapter 7: Working With Expected Rates
Calculating the Expected Value at the threshold that balances false negatives and false positives yields a 16% savings over a “Do Nothing Policy”. This targeted policy applies an overtime reduction policy to anyone with greater than a 28% class probability of quitting.
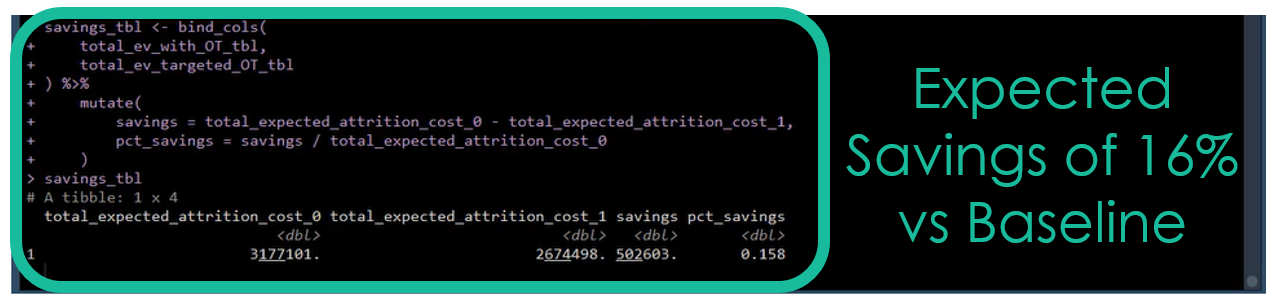
Chapter 7: Calculating Expected Savings Vs Baseline (Do Nothing)
We end Chapter 7 with a brief discussion on False Positives and False Negatives. The problem with using the threshold that maximizes F1 is that False Negatives are typically 3X to 5X more costly than False Positives. With a little extra work, we can do even better than a 16% savings, and that’s where Chapter 8 comes in.
Where We’re Going (Chapter 8): Threshold Optimization and Sensitivity Analysis
Chapter 8 picks up where Chapter 7 left off by focusing on using the purrr library to iteratively calculate savings. Two analyses are performed:
-
Threshold Optimization Using Cost/Benefit and Expected Value Framework - Maximizes profit (savings)
-
Sensitivity Analysis to adjust parameters that are “assumptions” to grid search best/worst case scenarios and to see there effect on expected savings.
The threshold optimization is the first step, which can be performed by iteratively calculating the expected savings at various thresholds using the purrr package.
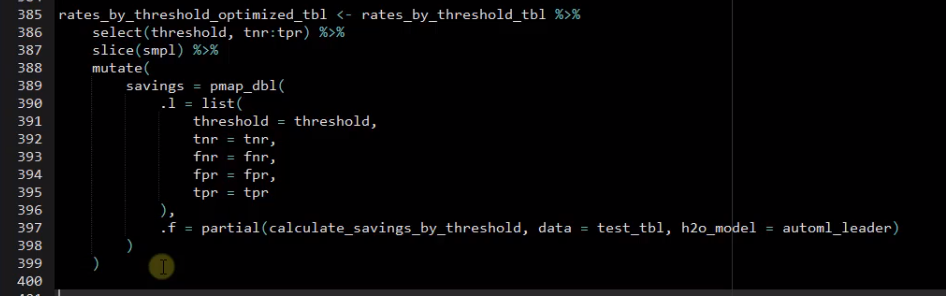
Chapter 8: Threshold Optimization With `purrr`
Next, the student visualizes the threshold optimization results using ggplot2.

Chapter 8: Visualizing Optimization Results With `ggplot2`
Sensitivity analysis is the final step. The student goes through a similar process but this time use purrr partial(), cross_df(), and pmap_dbl() to calculate a range of potential values for inputs that are not completely known. For example, the percentage overtime worked in the future is unlikely to be the same as the current year. How does that affect the model? How does the future overtime interact with other assumptions like the future net revenue per employee? Find out how to handle this by taking the course. :)
Next Steps: Take The DS4B 201 Course!
If interested in learning more, definitely check out Data Science For Business (DS4B 201). In 10 weeks, the course covers all of the steps to solve the employee turnover problem with H2O in an integrated end-to-end data science project.
The students love it. Here’s a comment we just received last Sunday morning from one of our students, Siddhartha Choudhury, Data Architect at Accenture.
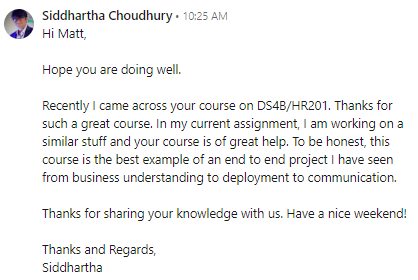
“To be honest, this course is the best example of an end to end project I have seen from business understanding to communication.”
Siddhartha Choudhury, Data Architect at Accenture
See for yourself why our students have rated Data Science For Business (DS4B 201) a 9.0 of 10.0 for Course Satisfaction!
Get Started Today!
Learning More
Check out our other articles on Data Science For Business!
Business Science University
Business Science University is a revolutionary new online platform that get’s you results fast.
Why learn from Business Science University? You could spend years trying to learn all of the skills required to confidently apply Data Science For Business (DS4B). Or you can take the first course in our integrated Virtual Workshop, Data Science For Business (DS4B 201). In 10 weeks, you’ll learn:
-
A 100% ROI-driven Methodology - Everything we teach is to maximize ROI.
-
A clear, systematic plan that we’ve successfully used with clients
-
Critical thinking skills necessary to solve problems
-
Advanced technology: H2O Automated Machine Learning
-
How to do 95% of the skills you will need to use when wrangling data, investigating data, building high-performance models, explaining the models, evaluating the models, and building tools with the models
You can spend years learning this information or in 10 weeks (one chapter per week pace). Get started today!
Sign Up Now!