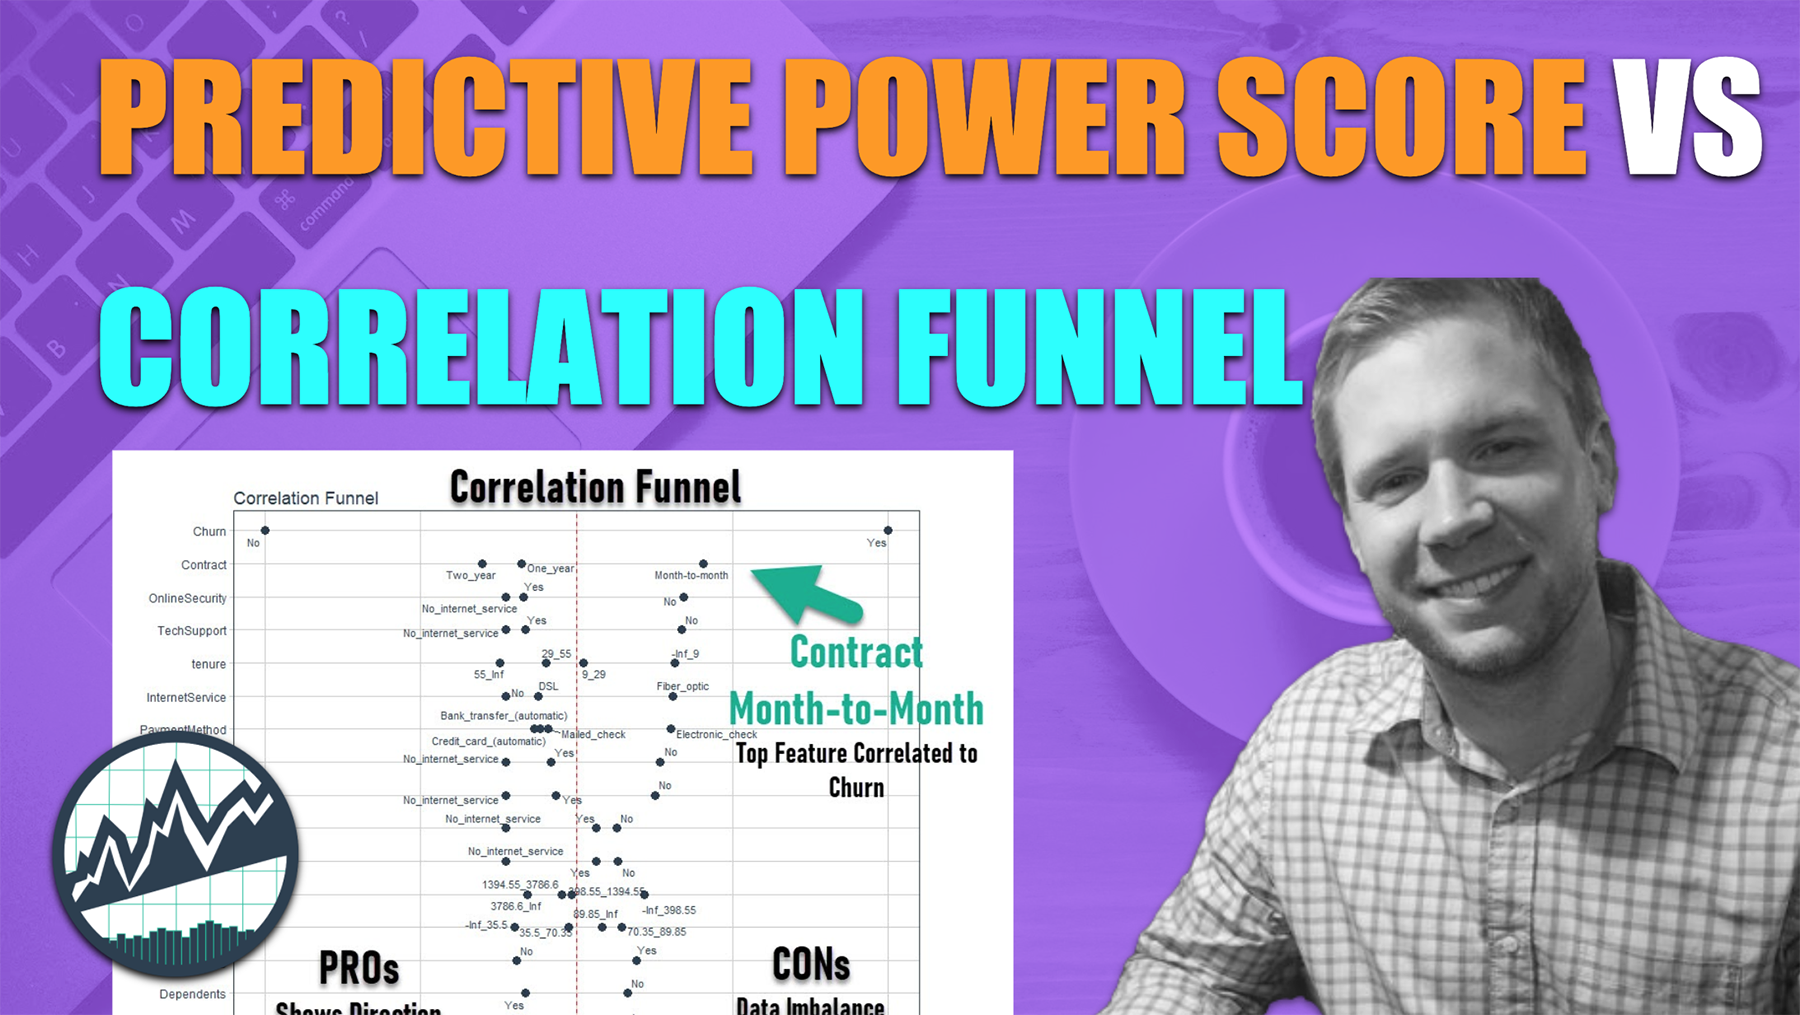
Predictive Power Score vs CorrelationFunnel
Written by Matt Dancho
This article is part of a R-Tips Weekly, a weekly video tutorial that shows you step-by-step how to do common R coding tasks.
Here are the links to get set up. 👇
 (Click image to play tutorial)
Battle of the EDA Packages
Exploratory Data Analysis (EDA) is what every data scientist does to understand actionable insights from the data.
This process used to take forever. Not anymore. We're kicking the tires on 2 EDA packages in a Battle Royale to
determine which one reigns supreme.
ppsr - An implementation of the Predictive Power Score.correlationfunnel - My R package that leverages a "binning trick" for inference using correlation.
As you follow along, you can use my Ultimate R Cheatsheet. It consolidates the most important R packages
(ones I use every day) into 1 cheatsheet. We'll also be using the tidyverse and tidymodels / xgboost from the cheatsheet as the tie-breaker.
So let's get started. You're making these data visualizations today:
The Drawbacks of Correlation
Did you know that you miss important insights with correlation?
Correlation plots are must-know plots. Everyone understands correlations (even non-technical people). Correlation are great for explaining insights in simple terms:
- Magnitude (between zero in one): two features have a higher degree of relationship the closer the magnitude gets to one.
- Sign (Positive/Negative): A positive sign indicates a positive relationship (both go up). A negative sign indicates an inverse relationship (as one goes up, the other goes down).
But Correlation has serious drawbacks.
- Doesn't work well with Non-Linear Relationships
- Doesn't work on Categorical Data
Enter the Predictive Power Score, a new technique for finding relationships.
The Contender: Predictive Power Score
An enhanced version of the traditional correlation that scores feature importance
Predictive Power Score fixes the issues. It works with:
- Non-Linear Relationships
- Categorical Data
Here's the implementation in the ppsr package.
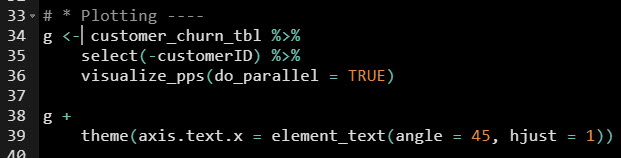
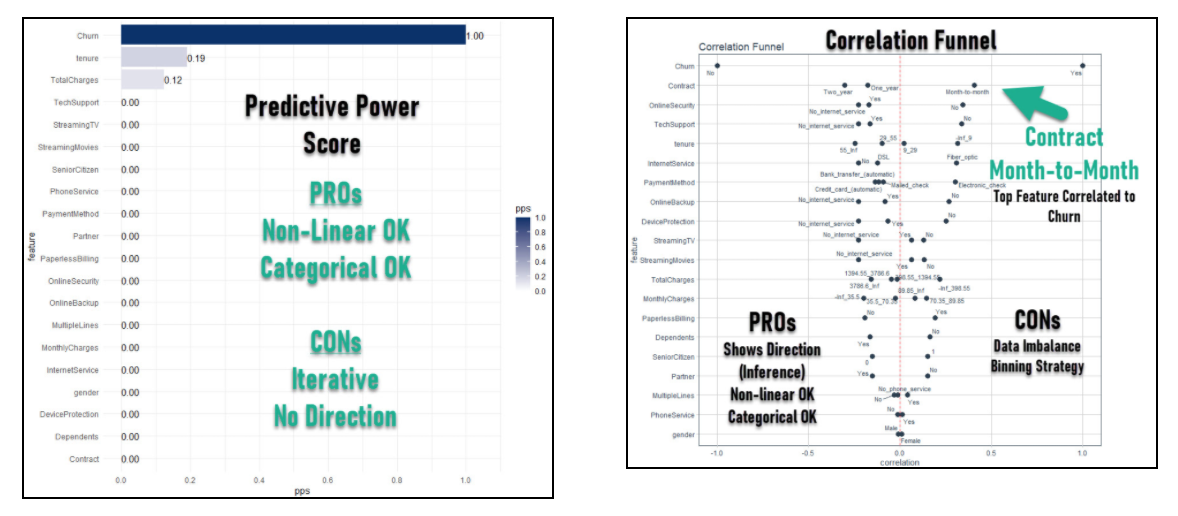
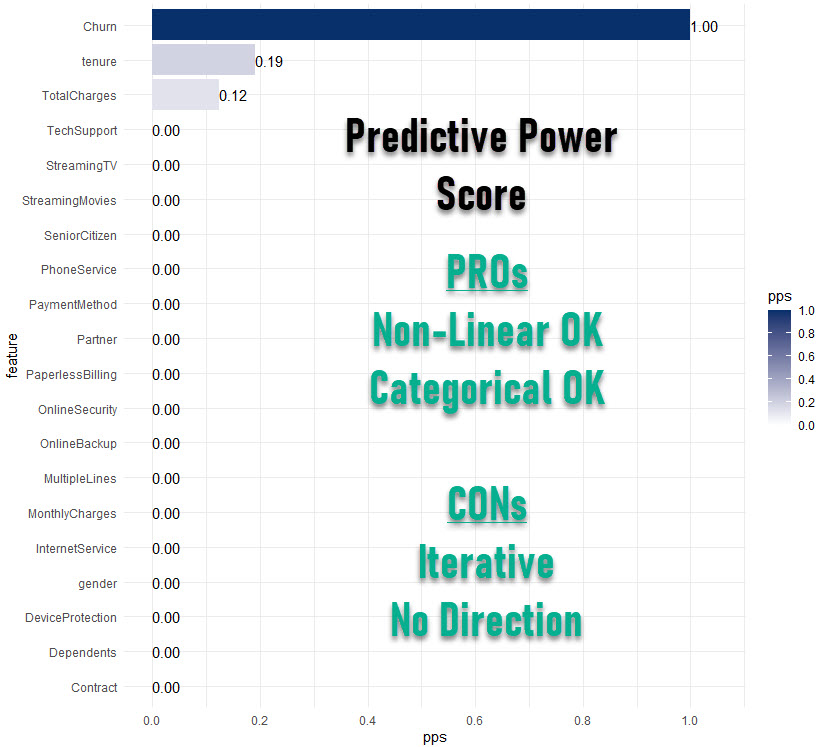
This outputs a nice "PPScore Heatmap", which looks very similar to a Correlation Matrix Heatmap. We can see that Tenure and TotalCharges are the top features identified with relationship to Churn.
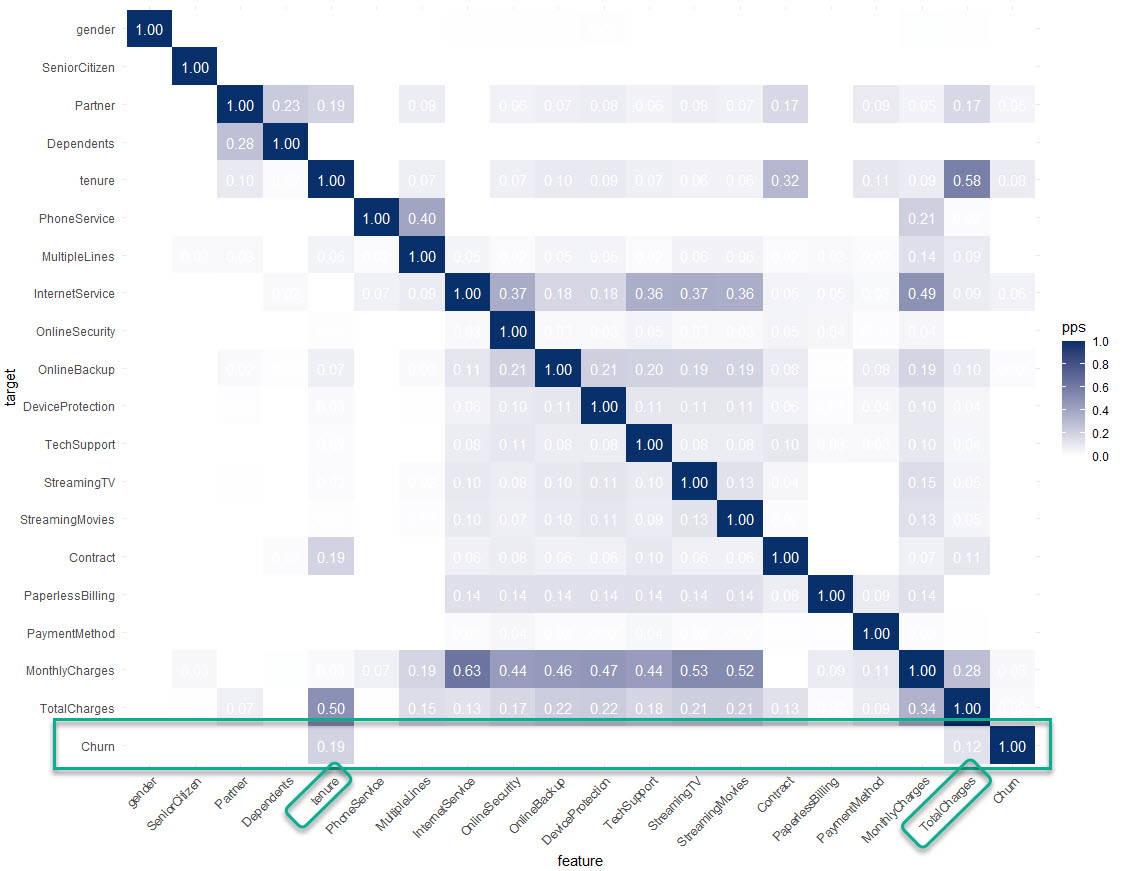
Awesome. In a few lines of code, we got some insights telling us to look closer at TotalCharges and Tenure.
But did the PPScore miss anything?
Let's try another method: My Correlation Funnel R Package.
The Defender: Correlation Funnel
Uses the "binning trick" to fix the issues of traditional correlation
Correlation Funnel fixes the issues with traditional correlation using a clever binning strategy (i.e. the "binning trick") that allows categorical data to be one-hot encoded and numeric features to be binned into binary groups.
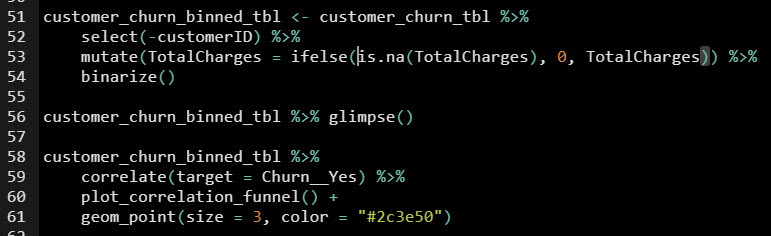
- First
binarize() the data - Note this changes the columns in your data using the "binning trick"
- Then
correlate()- Make sure to use the binarized target variable name (Churn__Yes)
- Then visualize with
plot_correlation_funnel()
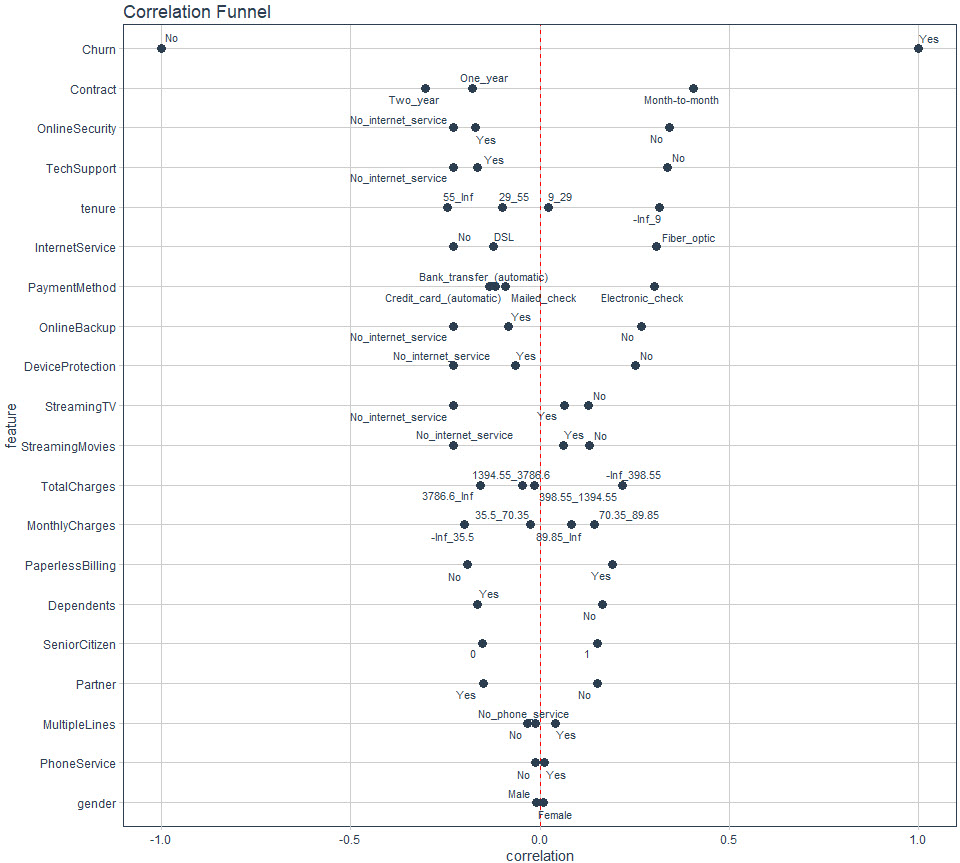
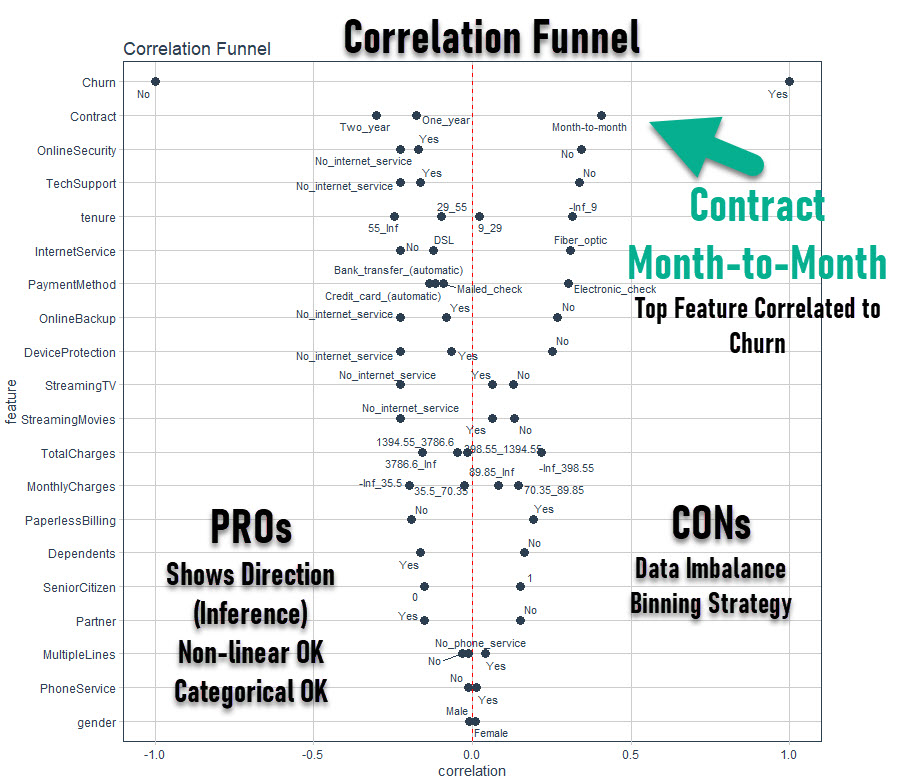
This creates an easy to infer plot that shows not only magnitude of relationship, but also which parts of the feature correlate most with the segment of interest (e.g. Contract= Month-to-Month correlates with Churn=Yes).
We see new features that PPScore didn't have:
- Contract
- Online Security
- Tech Support
Which is right? We need a tie-breaker.
Tie-Breaker: XGBoost + VIP
Use feature importance from a model designed for non-linear relationships
To help us decide which to believe, we can use a 3rd model - XGBOOST:
- Xgboost works well with non-linear data (tree-based, very accurate)
- We can get variable importance from Xgboost
Watch the YouTube Video for this one.
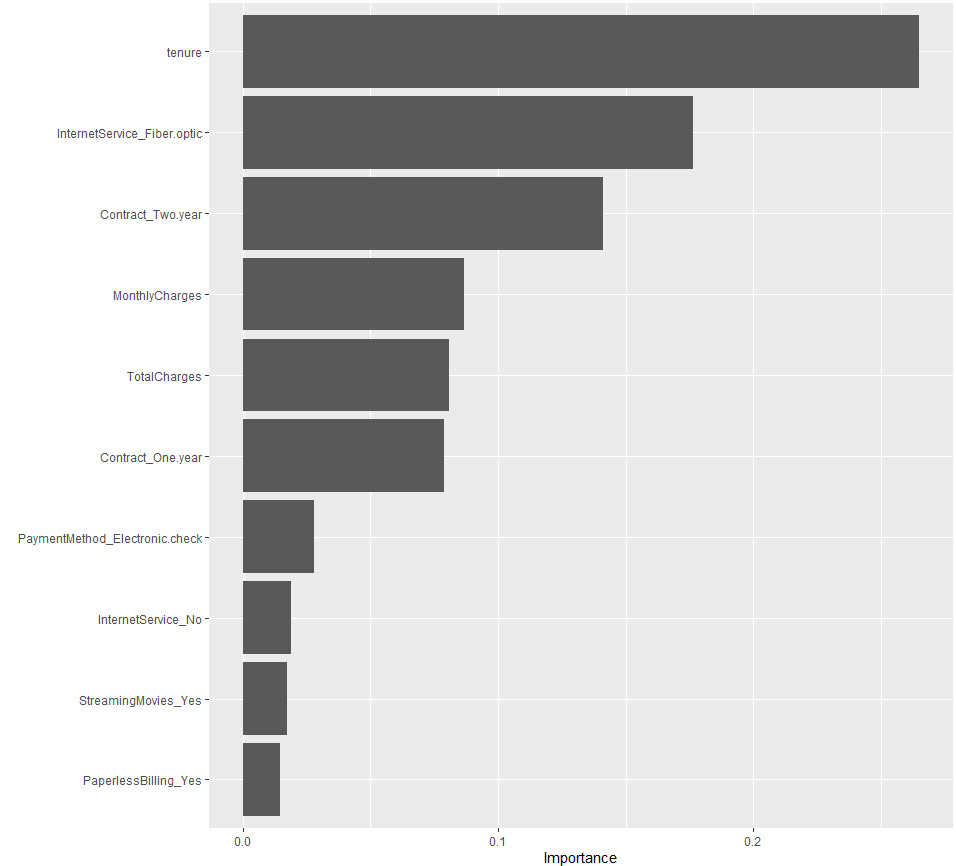
And the results are in, the top features for each method are:
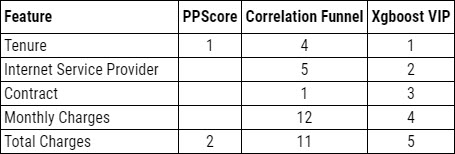
Interpretation of Results
- Each EDA method produced different results.
- My interpretation - Experiment! Use multiple types of EDA techniques.
- You learned 3 EDA Techniques in this tutorial.
Your boss
After he sees your new EDA skills...

But if you really want to improve your data skills...
Here's how to master R.
What happens after you learn R for Business from Matt.

This is career acceleration.
SETUP R-TIPS WEEKLY PROJECT
- Get the Code
- Check out the R-Tips Setup Video
Once you take these actions, you'll be set up to receive R-Tips with Code every week. =)